Research Article - Biomedical Research (2017) Volume 28, Issue 3
Interaction of an EM wave with the breast tissue in a microwave imaging technique using an ultra-wideband antenna
Vanaja Selvaraj1* and Poonguzhali Srinivasan21Rajalakshmi Institute of Technology, Chennai, Tamilnadu, India
2Anna University, Chennai, Tamilnadu, India
Accepted date: July 7, 2016
Abstract
The microwave imaging system is one of the most attractive techniques for detecting a tumour embedded in the breast tissue using an electromagnetic signal. The effect of a radio frequency wave interaction between the electromagnetic signal and the breast tissue using an array or an antenna has been found highly remarkable and significant. This study focuses on the effect of the electromagnetic wave interaction between the transmitting device and the breast tissue. The ultra-wide band antenna radiates the breast tissue with an electromagnetic signal having a wide bandwidth of 4.284-13.628 GHz. The power absorbed and the Specific Absorption Rate (SAR) for average masses of 1 g and 10 g of the breast tissue are presented at varying frequency, distance and size of the tumour. It is found that the power absorbed and the SAR value of the tissue increase with the increase in the frequency and size of the tumour. On the other hand, power absorbed and the SAR value of the tissue decreases with the distance between the transmitter and the breast. An SAR for a mass of 1 g of the tissue can also detect the location of the tumour in the breast tissue.
Keywords
Dielectric constant, Phantom, Specific absorption rate (SAR), Ultra-wideband (UWB).
Introduction
The application of the Radio Frequency (RF) devices that are commonly used in the area near or surrounding the human body is increasing. Therefore, it is required to assess the interaction between the human body and the Electromagnetic (EM) wave. It is believed that the human body is transparent to the EM waves emitted by the RF devices. The impact of the EM wave on the human body depends on its frequency. When the electromagnetic field is transmitted from the end to end of the human tissues, the energy associated with the electromagnetic wave is absorbed by the biological tissues [1]. The extended face-to-face consequence of the electromagnetic field is the heating of the human tissue. The biological reaction when human tissue is exposed to the electromagnetic field is of great significant. The heat effect of the tissue is normally quantified by the Specific Absorption Rate (SAR). SAR tends to be as small as possible to reduce the biological consequences [2]. The SAR value should not be beyond the level of exposure which becomes harmful [3,4]. The International Commission on Non-Ionizing Radiation Protection (ICNIRP) and the Institute of Electrical and Electronic Engineers (IEEE) has set safety standards followed for human safeguard and protection from electromagnetic fields [5]. For instance, the maximum SAR described in the IEEE C95.1:1999 guidelines is 1.6 W/kg for an average mass of 1 g, whereas in the International Commission of Non- Ionizing Radiation (ICNIRP) the standard is specified as 2 W/kg for an average mass of 10 g [3]. Generally, the SAR value is affected by different parameters such as the location of the antenna corresponding to the human body, the strength of the radiation of the antenna, the radiated power intensity, and the categories of the antenna [6]. Furthermore, the values of SAR are determined on the basis of frequency, intensity, near field or far field, the dielectric properties of different tissues, and the reflection, absorption and scattering effects of the related objects in the field close to the exposed body. This work focuses on the construction of a 3D model that is suitable for studying the process of the penetrating EM wave. Furthermore, the evaluation focuses on the power absorption and SAR calculation considering various operating frequencies of the antenna, different distances of the phantom from the antenna, different sizes of the tumour, and various locations of the tumour. The approach of the SAR calculation is examined using an omnidirectional Ultra-Wide Band (UWB) antenna that is commonly used in the application of a microwave image.
UWB Antenna Design
A UWB antenna design and simulation is constructed using Computer Simulation Technology (CST) software [7]. The CST software is a supporting tool for 3D electromagnetic simulation that allows high accurate result. This 3D simulator can be used to model any form of 3D design without any experimental errors.
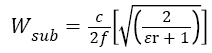
The proposed UWB antenna is designed by adjusting the length of the inverted L-shaped conductor in the ground plane and also the length and width of the feed line [8]. The proposed ultra-band antenna which is fed at the end by an inset feed line generally yields a high input impedance as shown in Figure 1. The feed line is printed above an FR4 dielectric substrate of 1.6 mm thickness. The width of the substrate is given by

Figure 1: Geometry of a UWB antenna (a) Bottom view and (b) Top view.
 →(1)
→(1)
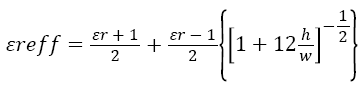
Where “c” is the velocity of light in the free space. The minimum value of the effective dielectric constant for a microstrip antenna is
 →(2)
→(2)
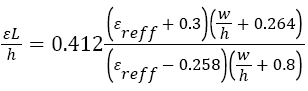
The extension of length is calculated as follows:
 →(3)
→(3)
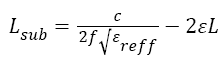
Because of the fringing effect at the two edges, the effective length of the microstrip antenna is calculated by the following equation:
 →(4)
→(4)
In view of the fringing field, the length of the microstrip looks significantly longer than its physical dimension (i.e., the addition of ΔL on both sides). The primary structure of the proposed antenna contains a square shaped radiating patch of dimension L × W=10 × 10 mm2, an inset feed line, and a ground plane. The patch of the antenna is coupled to a feed line with a width of Wf =2.1 mm and length Lf=10 mm. The proposed antenna contains the substrate having a width of Wsub=12 mm and length Lsub=18 mm.
A partially ground plane is rectangular in shape, which is made of copper (annealed) and has dimensions as specified in Table 1. The change in the width of the radiating patch is directly related to the bandwidth of the antenna. The bandwidth of the UWB antenna decreases with the decrease in the width of the patch and vice versa.
| Parameter | Value(mm) | Parameter | Value(mm) |
|---|---|---|---|
| W1 | 3.25 | L3 | 0.6 |
| L1 | 3.5 | W6 | 0.5 |
| W2 | 1 | W4 | 1.5 |
| Lgnd | 3.5 | L4 | 0.6 |
| Wsub | 12 | D | 1 |
| L2 | 1.8 | W3 | 4.5 |
| W5 | 2.5 | L5 | 2.75 |
Table 1: Final dimensions of the ground plane.
Design of the Homogeneous Breast and Tumour
The detection of the breast cancer based on an ultra-wide band imaging technique is under analysis. UWB imaging method largely depends on the nature of the breast tissue. Therefore, the values of the exact dielectric properties of different breast tissues are not crucial for application of imaging technique. The proportionate values of the dielectric constants for various breast tissues [9,10] are as follows: it is roughly about 1 for fatty tissues and the skin value ranges from 1.5 to 5 whereas the value ranges from 2 to 4 for the fibro-glandular tissue. At the same time, the tumour property varies between 9 and 10 or even more [11,12]. Some researchers reported that these proportions are not fixed and can vary [10,12-16]. Another dielectric property of the tissues present in the human body is related to the amount of the water content [10,12,16,17]. The breast tumour with distinct values of the dielectric constant can be generated by mixing water to wheat flour in different proportions. The simulated breast phantom possesses the following tissue properties, e.g., the tumour model is considered for dielectric properties with a combination of water with wheat flour (55%) as εr=23 and σ=2.57 s/m and the fatty tissue is considered for a dielectric constant of pure petroleum jelly with εr = 2.36 and σ=0.012 s/m [18].
A homogeneous breast phantom of hemispherical shape, consisting of a fatty tissue layer with a radius of 30 mm, is shown in Figure 2a. The shape of the phantom is similar to the breast when the patient is in the prone position. A tumour of the size of 3 mm located in the breast tissue at a distance of 45 mm from the transmitter antenna is shown in Figures 2b and 2c.

Figure 2: (a) Breast phantom (b) Phantom with a tumour (c) Phantom with a transmitter.
Specific Absorption Rate
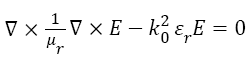
The propagation of the electromagnetic wave in the human body is determined by the mathematical calculation using Maxwell’s equation [19,20]. This equation relates the mutual dependence between the electromagnetic wave and the human tissue. The demonstration of the propagation of the electromagnetic wave in the breast tissue is explained using the following Maxwell’s equation:
 →(5)
→(5)
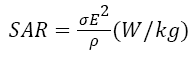
Where E represents the electric field intensity (V/m), μr is the relative magnetic permeability, εr is the relative dielectric constant, and k0 is the wave number of the free space (m-1). When a nonionizing electromagnetic wave penetrates through the human body, the tissues in the human body absorb the energy of the wave. The fields of the electromagnetic wave interacting with the biological medium can be described in terms of the value of the Specific Absorption Rate (SAR). SAR is the measure of the energy absorbed by a tissue when exposed to the electromagnetic wave.
 →(6)
→(6)
Where σ (S/m) represents the conductivity of the biological material, ρ (kg/m3) is the material density, and E (V/m) is the electric field strength.
Result and Discussion
In this module, the ultra-wideband monopole antenna with different design variables was formulated. The analyses of the SAR and power absorption values of the breast phantom with a change in the location of the tumour, the size of the tumour, variation in the radiation frequency, and variation in the distance between the antenna and the phantom are discussed. The absorption of the electromagnetic wave propagation in the breast tissue is determined using CST software.
Antenna parameter measurements
The return loss and Voltage Standing Wave Ratio (VSWR) for the ultra-wideband monopole antenna is discussed in Figure 3. Figure 3a shows the simulated S11 curve corresponding to the band of frequency from 2 GHz to 16 GHz. From the Figure, it can be observed that the bandwidth of the proposed antenna is 9.23 GHz. Figure 3b shows that the simulated VSWR characteristics of the monopole antenna are below 2.

Figure 3: Simulated characteristics of the ultra-wideband antenna (a) Return loss (b) VSWR.
Thermal distribution of the phantom
The thermal distribution for a UWB antenna, caused by the propagation of the electromagnetic signal inside the breast phantom has been determined. The strongly affected area nearby the transmitter whose back and front projections with masses of 10 g and 1 g of the tissue with a frequency of 5 GHz are shown in Figures 4a and 4b, respectively.

Figure 4: SAR distributions in breast tissue (a) 10 g of tissue (b) 1 g of tissue.
The distance between the monopole antenna and the breast phantom is 20 mm and they are simulated at a frequency of 5 GHz. The breast phantom is hemispherical in shape, which is the replication of the real breast with a diameter of 30 mm. SAR is calculated using an ultra-band antenna for average masses of 1 g and 10 g of the tissues.
The American countries follow the SAR value with an average of 1 g of the tissue and the European countries follow the value with an average on 10 g of the tissue. The red colour of the tissue corresponds to the most affected area, the gradient colour represents the least affected area, and the blue colour represents the non-affected area. The actual coordinate of the tumour in the fatty tissue of the breast is as follows: x=0 mm, y=0 mm, and z=55 mm. SAR for a mass of 10 g of the tissue does not show the location of the tumour (x=-0.125 mm, y=0.9375 mm, and z=41.8111 mm), but SAR for an average mass of 1 g of the tissue shows the most approximate coordinate of the tumour position (x=0.125 mm, y=0.1875 mm, and z=49.8125 mm). For a frequency of 5 GHz, the extreme temperature is increased to obtain the SAR values of 0.389009 W/kg and 0.142686 W/kg in a monopole antenna for the American and European standards, respectively.
SAR and power absorption variations for different frequencies
The systematic outcome of the maximum SAR value varies according to the frequency (GHz) as shown in Figure 5.

Figure 5: Maximum SAR distribution.
The solid line indicates an SAR for a mass of 10 g of the tissue. The dashed line specifies an SAR for an average mass of 1 g of the tissue. The points in the graph line show the analytical point of the SAR at a particular frequency.
In a microwave imaging technique, a UWB antenna is used to detect the location of the tumour at various frequencies. The analysis shows that the SAR for 1 g and 10 g of the breast tissues becomes larger as the frequency increases.
The analytical result shows that the power absorbed by the breast tissue varies as a function of frequency as shown in Figure 6. The evaluation of data shows that the frequency increases as the power absorbed by the tissue increases.

Figure 6: Absorbed power as a function of frequency function of frequency.
SAR and power absorption variation versus distance
The effective performance of the SAR depends on the distance between the breast tissue and the transmitter antenna.
Figure 7 shows that as the distance between the breast tissue and the transmitter antenna increases, the SAR value for the cubic masses of 10 g and 1 g of the tissue decreases. Figure 8 depicts that the power absorbed by the tissue reduces with the distance between the phantom and the monopole antenna. Hence, the distance between the transmitter and the breast tissue should be above 20 mm in a microwave image application.

Figure 7: SAR value versus distance.

Figure 8: Power absorption value versus distance.
SAR and power absorption variations for different sizes of the tumour
The effective performance of the SAR value depends on different sizes of the tumour, which ranges between 1 mm and 8 mm within the breast tissue and the transmitter antenna. Figure 9 depicts that as the size of the tumour increases the SAR value for the cubic mass of 10 g and 1 g of the tissue increases.

Figure 9: SAR value versus the size of the tumour.
Figure 10 shows that the power absorbed by the tissue increases with the increase in the size of the tumour inside the phantom model.

Figure 10: Power absorbed versus the radius of the tumour.
Detection of tumour for 1 g of SAR
The breast tissue with a radius of 30 mm is placed at a distance of 20 mm from the transmitting ultra-wide band antenna. A tumour with a radius of 3 mm is placed at different locations inside the breast tissue. The breast tissue is simulated for the SAR value with an average mass of 1 g of the breast tissue. The total mass of the breast tissue is calculated as 0.050965 kg.
| Tumour location | Result location |
|---|---|
| 0, 0, 23 | 2.25, 0.5625, 25.0625 |
| 5, 7, 30 | 7.08103, 6.09428, 27.9375 |
| -2, -3, 45 | -1.625, -2.83333, 43.3125 |
| 7, 9, 45 | 5.8125, 8.82549, 44.4375 |
| -7, -9, 45 | -5.4375, -7.5, 42.9375 |
| 13, 17, 37 | 13.9375, 11.0625, 31.4375 |
Table 2: Location of the tumour for SAR of a mass of 1 g.
Conclusion
The primary objective of this study is to analyse the power absorbed by a tissue and the SAR distribution in the homogeneous breast tissue exposed to an antenna in a microwave imaging application. First, a monopole antenna with an enhanced bandwidth of 4.31-13.63 GHz has been discussed. The given bandwidth range was produced by introducing two pairs of L-shaped slots in the ground layer. In this paper, a careful study has been made of the important characteristics of energy absorption in the breast tissue with a good number of simulations. It has been found that the power absorbed and SAR for average masses of 1 g and 10 g of the tissue increase with the increase in frequency, the size of the tumour and the phantom, while it is contrary with the distance between the transmitter and the phantom. When the breast tissue is exposed directly to the electromagnetic signal, heat energy is produced. Hence, care should be taken during the application of imaging process. In this context, I would also like to suggest that future work may focuses on SAR measurements of the heterogeneous breast tissue using other type of the monopole antenna.
References
- WessapanT, Siramate S, Phadungsak R. Specific absorption rate and temperature distributions in human head subjected to mobile phone radiation at different frequencies.Int J Heat Mass Trans2012; 55: 347-359.
- Liu X. Conductivity and frequency dependent specific absorption rate.J ApplPhys2013; 113: 074902.
- IEEE Standards Coordinating Committee 28 on Non-Ionizing Radiation Hazards.IEEE Standard for Safety Levels with Respect to Human Exposure to Radio Frequency Electromagnetic Fields, 3kHz to 300 GHz. InstElectrcElectrEngInc 1992.
- International Non-Ionizing Radiation Committee of the International Radiation Protection Association. Guidelines on limits on exposure to radio frequency electromagnetic fields in the frequency range from 100 kHz to 300 GHz. H Phy1988; 54: 115-123.
- Lak A, Homayoon O. Evaluation of SAR distribution in six-layer human head model.Int J AntenPropag2013; 2013: 1-8.
- Fung LC, Leung SW, Chan KH. An investigation of the SAR reduction methods in mobile phone applications.Electromagnetic Compatibility 2002.
- Computer Simulation Technology (CST) Microwave Studio Software, Version 2010.
- Ojaroudi N, Mouhammad O, Yasser E. UWB/omni-directional microstrip monopole antenna for microwave imaging applications.ProgElectromag Res 2014; 47: 139-146.
- Fear EC, Jeff S, Maria AS. Experimental feasibility study of confocal microwave imaging for breast tumor detection.I Trans Microwave Theory Tech2003; 51: 887-892.
- Li X. Microwave imaging via space-time beam forming-Experimental investigation of tumor detection in multilayer breast phantoms.Microwave TheoryTech I Trans 2004; 52: 1856-1865.
- Sill JM, Elise CF. Tissue sensing adaptive radar for breast cancer detection-experimental investigation of simple tumor models. Microwave TheoryTech I Trans 2005; 53: 3312-3319.
- Lazebnik M. A large-scale study of the ultra-wideband microwave dielectric properties of normal, benign and malignant breast tissues obtained from cancer surgeries.Phy Med Biol2007; 52: 6093.
- Lim HB. Confocal microwave imaging for breast cancer detection: Delay-multiply-and-sum image reconstruction algorithm. Biomed Eng I Trans 2008; 55: 1697-1704.
- Xiao X, Takamaro K. Study on the breast cancer detection by UWB microwave imaging.Microwave Mm Wave Technol 2008 ICMMT 2008; 4.
- Sha L, Erika RW, Brandon S. A review of dielectric properties of normal and malignant breast tissue.Southeast Con Proc I 2002.
- Joshua CY. Homogeneous and heterogeneous breast phantoms for ultra-wideband microwave imaging applications.ProgElectromagn Res2010; 100: 397-415.
- Halloran M, Martin G, Edward J. Effects of fibroglandular tissue distribution on data-independent beamforming algorithms.Progress In Electromagnetics Research2009; 97: 141-158.
- Alshehri SA.Experimental breast tumor detection using NN-based UWB imaging. ProgElectromagn Res2011; 111: 447-465.
- Wessapan T, Siramate S, Phadungsak R. Numerical analysis of specific absorption rate and heat transfer in the human body exposed to leakage electromagnetic field at 915 MHz and 2450 MHz.J H Trans2011; 133: 051101.
- Spiegel RJ. A review of numerical models for predicting the energy deposition and resultant thermal response of humans exposed to electromagnetic fields.Microwave Theory Tech ITrans1984; 32: 730-746.