Research Article - Biomedical Research (2018) Volume 29, Issue 1
Improving performance of coronary artery segmentation using calculated vessel location from the angiogram
Mehmet Emin Tenekeci1*, Hüseyin Pehlivan2 and Yasin Kaya2
1Department of Computer Engineering, Harran University, Sanliurfa, Turkey
2Department of Computer Engineering, Karadeniz Technical University, Trabzon, Turkey
- *Corresponding Author:
- Mehmet Emin Tenekeci
Department of Computer Engineering
Harran University
Sanliurfa, Turkey
Accepted date: October 24, 2017
DOI: 10.4066/biomedicalresearch.29-17-2006
Visit for more related articles at Biomedical ResearchAbstract
Vessel segmentation in X-Ray Coronary Angiography (XCA) images, which is used for the diagnosis and treatment of anomalies in coronary vessels, has been an intriguing topic in recent years. Due to dynamic background and ambiguous brightness distribution, success rate in segmentation is low and realization has been a challenging process. This paper presents a new approach to increase the success rate of segmentation in XCA images. For this purpose, the vessel structure position is first determined with foreground detection algorithm in the XCA image sequences. Next, state of the art methods of vessel identification and image thresholding used for vessel structure segmentation are being experimented in full and foreground images. The contribution of the suggested method to the success of the segmentation is revealed with the experiments carried out. The scales of sensitivity, specificity and accuracy are given in the paper to evaluate the success of the segmentation. The results were compared with the angiography images segmented manually by a specialist physician. Without proposed detection of candidate vessel location, highest accuracy results 92.4 is achieved with Multiscale Gabor filter and PTile thresholding. Frangi Filter and Otsu thresholding algorithm reached the highest success rate of 93.81 by using the proposed method. All the experiments have shown that accuracy of vessel segmentation is increase by the proposed approach.
Keywords
Coronary angiography, Image segmentation, Vessel detection, Mixture of gaussian, Thresholding
Introduction
According to World Health Organization data 7.4 million of the 17.5 million people who died due to cardiac diseases in the year 2015 passed away because of coronary cardiac anomalies [1]. X-ray coronary angiography (XCA) is considered as the “gold standard” in the diagnosis and treatment of cardiovascular diseases (CD) [2]. XCA is formed of twodimensional (2D) image series that display the internal structure of the coronary arteries (CA) into which the contrast agent was injected with the aid of catheter under X-ray, which made it the most effective technique to diagnose atherosclerosis disease. The automatic segmentation of the coronary arteries has gained importance for the computer aided diagnosis systems. But XCA have dynamic background structure forming from diaphragm, lungs, bones, catheter, respiration and heartbeats. Moreover, due to the nature of Xray imaging, the images have quantum noise [3]. The images have low contrast and non-uniform illumination range between vessel structures and background. All these adverse effects reduce the image quality and make the accurate segmentation of CA difficult.
Image processing techniques have been utilized to increase the CA segmentation performance. Great deal of studies on the emphasis of vessel structures and image enhancement has been carried out in recent years. They have used the entire image on a single frame for CA segmentation. But in this study, the CA position was determined using the whole image sequence instead of a single frame. This way, we narrow down working area by applying the image processing algorithms only into CA position, thus shortening the process time and increasing the segmentation performance.
In the first and last frames of the XCA image sequence’s vessel structures are not visible, after the contrast agent was injected in the vessel, it will be visible under X-Ray. By using this situation, location of vessels can be detected. The moving foreground areas can be determined using the all frames of XCA Image Sequences with the contrast agent which were injected in this method is facilitated to detection with changes in image. Segmentation success will be increased by detection of stationary areas in the image, such as the spine, ribs, and diaphragms that make segmentation difficult.
The studies performed on the vessel detection in recent years can be divided into three groups; the methods of pixel neighbourhood relations, Hessian matrix based methods and the methods applied in frequency domain.
Within the methods of pixel neighbourhood relations, the mathematical morphological algorithms are used commonly. Qian et al. [4] has used linear multi-scale top-line operator to enhance the angio images. Then they have segmented the vessel areas by transforming them into skeletons with morphological erosion. Maglaveras et al. [5] have enhanced the images by using connected component operator. Lara et al. [6] have used region growing method for this purpose. The morphological methods provide respectable results with the high contrast and noiseless images, but similar successful results are not achieved with the low quality and highly noisy XCA images. Chaudhuri et al. [7] have recommended the Gaussian Matched Filter (GMF) to overcome the disadvantages of morphological operators. By using various scaled and oriented filters in the spatial domain, all the vessel structures in XCA have been highlighted. On the other hand, Truc et al. [8] have increased the visibility of the vessel structures that are lined-like using a filter bank. Chang et al. [9] tried to detect boundary of the vessel structures using the snake algorithm.
The second group of vessel detection methods are Hessian matrix based algorithms recommended by Frangi et al. [10]. The vessel structures have been highlighted via the Hessian matrix that is formed with the calculation of the values of partial differentiated Gauss filter. The eigenvalues of Hessian matrix have varied for vessel structures and background areas. Wink et al. [11] used Frangi’s method to calculate the centre of the vessel and Bekkers et al. [12] used it to detect some features of the vessels for the diagnosis of diseases.
Filtering has also been carried out in the frequency domain to improve the quality of XCA images. Wavelet transformation was used to improve the vessel image by Rodrigues et al. [13]. Sang et al. [14] and Rangayyan et al. [15] tried to increase the success of the segmentation by making the vessel structure clear. On the other hand, Aceves et al. [16] calculated the parameters that are proper for the single-scale Gabor strain with Boltzmann Univariate Marginal Distribution Algorithm (BUMDA).
In our study, thresholding is performed as the last step to obtain vessel structure. Thresholding, which is basically used to divide an image into more than one group, is utilized to separate the vessel and background in XCA images from each other. The methods used by Otsu [17] and Kapur et al. [18] calculated threshold values in accordance with the image brightness histograms. The P-Tile method proposed by Doyle [19] performs thresholding by calculating the size of the area to be segmented.
In this study, it was proposed new approach detailed in Figure 1 to detect vessel areas based on the variation intensity in the XCA image sequence to improve success of the segmentation vessel structures. In order to process the vessel structure thoroughly, the calculated foreground area has been expanded by morphological operations. Enhancement and thresholding algorithms were applied only to the areas determined as foreground, and the performance and accuracy of segmentation were examined. Multi-scale Gabor, GMF and Frangi filter methods were used for the enhancement process. The vessels were segmented after thresholding the obtained enhanced images via Otsu, Kapur and P-Tile methods. In order to evaluate the performances of the methods, the vessel structures obtained were compared with the vessels manually segmented by the experts. Specificity, sensitivity and accuracy values were calculated, and results were given as to show the performance of the method.

Figure 1: New approach to detect vessel areas based on the variation intensity in the XCA image sequence.
The rest of this paper is organized as follows; the fundamentals and the theory of the methods are explained in section 2; experimental results along with information about the data set are given in section 3 and conclusions are discussed in section 4.
Material and Methods
In this section, that the method, which is the remarkable point of this study, is detected of the vessels areas locating from the image sequence is explained. And it is described theory of the methods that are used to detect the vessel structures in the obtained vessel images and referred to automatic thresholding algorithms. Finally, the evaluation criteria of the results are mentioned at the end of the section.
Foreground detection with mixture of gaussians
XCA images are obtained by capturing X-rays passing through the body during catheter-assisted injection of contrast material into the coronary arteries. The vessel cannot be seen in the first frames, it can only be seen in the following frames. These changes in the image sequence impact Gaussian distribution functions belonging to the images. For this reason, Gaussian distribution functions are used as a statistical background detection method.
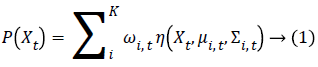
Recommended by Stauffer et al. [20], the Mixture of Gaussian Model (MoG) defines the brightness values of each pixel as K Gaussian Distribution Function (Gaussian Distribution Function). Xt is the density value of the pixel, ωi,t at time t, μi,t average, i. Gaussian distribution’s weight, Σi,t covariance matrix, η Gauss probability density function what the probability function of the pixel value that can be calculated at a time t is calculated as shown in Equation 1.
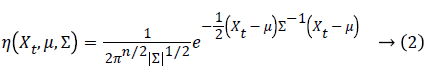
The Gaussian probability density function η is defined as in Equation 2. The value of n is taken as 1 because the images to be used in the study are one colour band.
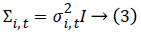
As to covariance matrix which used for the calculation of η value is processed as shown in Equality 3.
Gaussian distribution model is obtained by sorting the calculated distribution functions. The background and foreground are calculated according to the determined threshold value T shown in Equality 4.
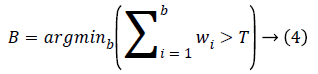
The calculation will be performed for b density functions with the highest weight. Each new frame is compared to MOG by Mahalanobis distance shown in Equation 5.

If the comparison result is equal, the weight, mean and variance values of the distribution are recalculated defined to Equality 6,7,8.

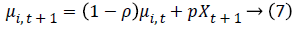
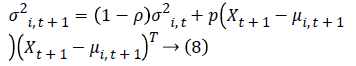
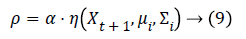
In these equations, α is the learning coefficient and ρ value is calculated depending on α as shown in Equation 9.
Mean and variance are not updated during distributions of pixels that do not match the model. Only the weight value of is changed. If the pixel in the new frame does not match any gaussian distribution, the lowest priority distribution is changed to the new frame distribution. This new distribution has the smallest weight, the highest variance and the average. The calculation is made according to the number of frames to be used for background determination. As a result, the highest priority distributions are considered as the background and the lowest priority distributions as the foreground.
Vessel detection methods
For the success rate of segmentation process can be improved by increasing the visibility of the vessel structures in low quality XCA images. For this purpose, Gabor, GMF and Frangi methods, which are state of the art algorithms, were used in our study. These vessel detection methods are selected from each of the classes described in the introduction.
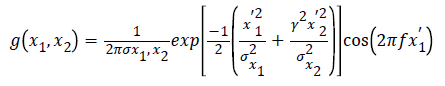
Multiscale Gabor Filter (MGF): The Multiscale Gabor filter [14,16] consists of filter banks that are various in size and direction in wavelet domain. Because the CA structure has different orientations and dimensional vessels, it can be detected with the use of MGF. The characteristics of vessels are emphasized with the Gabor filter response from XCA images. Gabor filter kernel is stated as seen in Equation 10.
 (10)
(10)
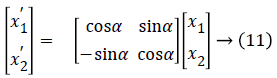
σ values denote the scale of Gauss equation; ƒ denotes frequency values and y denotes spatial aspect ratio. The aspect and the curvature of the object are indicated with the parameter y. Given x1 and x2 values are calculated as shown in Equation 11.
{gk=(x1,x2, k=0,1,…K-1} shows K quantity of Gabor filters that vary in between  and oriented in the form of
 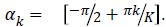 '
'
 shows the input image and
  shows the images that were filtered with
  .
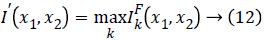
.  filtered image is worked out from the maximum response that is calculated with Equation 12.
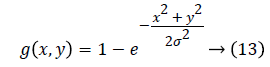
Gaussian Matched Filter (GMF): Gaussian match filter [7,8] consists of several filters that are multi-dimension and multidirection. Multiple sized and oriented filters are used together because of the different vessel size and orientation. CA vessel visibility is increased with filtering in spatial domain by GMF algorithm. The filters are derived from Gaussian curve shown in Equation 13 Different directional filters are derived from the Equation 14.
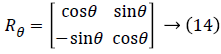
GMF had two parameters as dimension and direction. 6 Filters are used in size {11, 15, 19, 23, 27, 31}, considering vessel width. Filters are rotated in 15-degree angle
θand 12 different oriented filters are reproduced with this way. As a result, 6*12=72 filters are derived from different sized and orientation.
Frangi Filter: The method of proposed Frangi el al. [10] is widely used in medical image processing applications to determine vessel like tubular structures. The method, which is Hessian matrix based, is not much affected by the noise in the image. The 2D Hessian matrix shown in Equality 15 is generated with the second-order partial derivatives of the image.
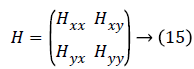
The eigenvalues of Hessian Matrix H are calculated as L1 and L2. The Hessian Matrix based vessel extraction filter that was recommended by Frangi is shown in Equality 16.
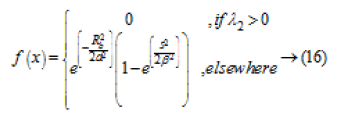
Equation 17 shows that filtered images which have the highest standard deviation will be used.  determines the cylindrically shaped structures. And
  eliminate the background noise.
Thresholding methods
As the last step of the work, vessel segmentation should be performed from XCA. In order to make all previous operations meaningful, the background and the CA structure must be divided in the XCA images. If the brightness distributions of the images are different from each other as XCA images, the threshold value must be calculated automatically. Thus, of the automatic thresholding determination methods; Kapur, P-Tile and Otsu will be used in this study. The threshold value is calculated such that the total entropy of the object and background pixels is highest with the Kapur method [18]. The Otsu algorithm [17] computes the threshold value that will determine the two classes that have highest variance in the image. The P-Tile algorithm [19] determines the threshold value according to the area ratio of the part to be segmented. The P value is manually calculated from segmented images by the expert [20].
Performance criteria
In the literature, sensitivity, specifity and accuracy measures are widely used to determine segmentation and classification performance. The values to be calculated will be between 0 and 1. If the result is 1, it means absolutely accurate segmentation was carried out. If the result is 0, it means that it is absolutely incorrect. The calculations are carried out with reference to manually segmented vessel images as accepted ground-truth by expert.
Sensitivity is defined as the correlation of the pixel number that was determined to be vessel in the segmented area to the pixel number that was really vessel in ground-truth. It is calculated as seen in Equality 18.
Specificity is the correlation of the pixel number that was marked as non-vessel to the pixel number that was really nonvessel as seen in Equality 19.
Accuracy is a method that includes the previous methods. As indicated in Equality 20, it is the rate of the number of accurately detected pixels to the number of total pixels.
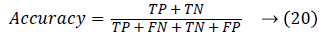
TP and TN show the number of the pixels that were correctly marked as vessel and non-vessel. FP and FN, on the other hand, show the number of pixels that were incorrectly marked as vessel and non-vessel.
Data Set and Experimental Results
In this section, dataset used for the experiments in the study are refered. The effect of the proposed method on the segmentation performance is shown in the experiments to be performed on the actual data set. The calculations are carried out in personal computer with Intel Core i3-4160 3.6 Ghz processor and 8 GB RAM via Matlab 2012 software.
The angiograms that were used in this study were provided by Harran University Hospital with ethics approval and the personal identifying information of the patients were cleared out. It has been used for experiments in 4 (RAO Caudal- Cranial and LAO Caudal-Cranial) examples from 8 different angles XCA taken from 10 different patients. The XCA is 512x512 pixels in size and consists of 120-150 frames. CA structures from the XCA that are compared with segmented images in this study were segmented manually by an expert physician. The experiments were carried out taking these vessel images as ground-truth information of angiograms.
The foreground accepted as vessel location is calculated from all frames in the XCA image sequence. As seen in the Figure 2, calculated foreground is location of vessel structure, because of the most difference between the frames is in these areas.

Figure 2: The foreground accepted as vessel location is calculated from all frames in the XCA image sequence.
In subsequent calculations, binary morphology erosion is performed to remove the small regions detected to decrease false positive rate. The foreground areas determined not to retain vessel locations are expanded by binary morphology dilation. The enlarged moving area and the visible portion of the XCA are shown in Figure 2. In the next steps, this area will be used instead of the whole image for vessel segmentation. Thus, we are get rid of some of the adverse factors mentioned in the introduction that make the segmentation difficult.
As can be seen in Figure 2, the detection of vessel areas in XCA images and the removal of non-vessel areas from the image are the pre-processes that will improve the performance of segmentation result. However, the workload of the proposed pre-processes increases the working time. It is calculated in the experiments that the image sequences with 512x512 resolution and 120-150 frames have a running time between 2.4 and 3.2 seconds.
Vessel segmentation is performed using the state of the art methods Multiscale Gabor, Gaussian Matched and Frangi filters for entire images and only detected candidate vessel area. In the next step, the images with enhanced and detect vessel structures are segmented with Otsu, Kapur and P-Tile methods.
Sensitivity, specificity and accuracy are calculated by comparing with the manually segmented vessel structures in order to evaluate the results of the segmentation that was carried out.
Segmentation performances of used methods are shown in the Table 1 and some obtained result of segmented images are shown in Figure 3. As can be seen in the Table 1 that shows the segmentation results of the used methods, Gabor filter, together with P-Tile thresholding method, is the most successful with high accuracy 92.49 without using proposed method. Especially specify metric is more positively affected by mentioned method; because of eliminate non-vessel areas. Recommended approach increased the segmentation performance from 92.49 to 93.81 with Frangi filter and Otsu thresholding algorithm.

Figure 3: Segmented images of used methods.
| Sensitivity | Specifity | Accuracy | |||||
|---|---|---|---|---|---|---|---|
| Detection Algorithm | Thresholding Algorithm | Entire Imagea | Calculated Vessel Areab | Entire Image | Calculated Vessel Area | Entire Image | Calculated Vessel Area |
| Gabor | Otsu | 70,82 | 70,34 | 90,22 | 91,90 | 87,07 | 88,40 |
| Kapur | 82,57 | 80,23 | 87,80 | 91,21 | 86,95 | 89,43 | |
| P-Tile | 90,08 | 84,92 | 92,95 | 92,64 | 92,49 | 91,39 | |
| Matced | Otsu | 73,45 | 72,80 | 90,90 | 92,69 | 88,07 | 89,46 |
| Kapur | 70,24 | 69,51 | 90,40 | 91,63 | 87,13 | 88,04 | |
| P-Tile | 72,59 | 70,50 | 91,38 | 92,14 | 88,33 | 88,63 | |
| Frangi | Otsu | 91,67 | 90,75 | 91,67 | 95,15 | 91,67 | 93,81 |
| Kapur | 75,99 | 73,51 | 91,63 | 92,54 | 89,09 | 89,45 | |
| P-Tile | 71,55 | 69,98 | 90,51 | 91,74 | 87,43 | 88,21 | |
Table 1. Vessel Segmentation Results of Detection and Thresholding Algorithms.
Finally, the performance of the segmentation methods available in the literature is also increased via the proposed method. With proposed method, CA can be segmented more accurately. Thus, more accurate segmented vessel segmentation is provided for the computer aided diagnosis systems.
Conclusion
In this paper, a novel approach to segmentation CA in XCA images has been proposed. In the proposed method, candidate vessel location of XCA image is calculated by MOG algorithm from image sequence. The mentioned method removes the non-vessel areas from the image. The success rate of the segmentation algorithms currently used in the literature is increased with the proposed approach. The impact of the suggested method on the segmentation performance carried out with Multiscale Gabor, Gaussian Matched and Frangi filters together with Otsu, Kapur and P-Tile automatic thresholding algorithms is also shown with experiments. According to the results given in the article, 92.49 the highest accuracy result is achieved with Multiscale Gabor filter and P-Tile thresholding without detection of the vessel location. With the proposed preprocessing method, the highest accuracy value is increased by 93.81 with Frangi filter and Otsu threshold method. According to the results, significant performance increase is achieved.
References
- World Health Organization www.who.int/mediacentre/factsheets/fs317/en/ (Accessed 20 July 2017)
- Mark D B, Berman DS, Budoff MJ, Carr JJ, Gerber TC, Hecht HS, Hlatky MA, Hodgson JB, Lauer MS, Miller JM, Morin RL, Mukherjee D, Poon M, Rubin GD, Schwartz RS. ACCF/ACR/AHA/NASCI/SAIP/SCAI/SCCT 2010 expert consensus document on coronary computed tomographic angiography: a report of the American College of Cardiology Foundation Task Force on Expert Consensus Documents, J Am Coll Cardiol 2010; 55: 2663-2699.
- Hasegawa B. The Physics of Medical X-Ray Imaging. Medical Physics Publishing Corporation; Madison, Wisconsin 1990.
- Qian Y, Eiho S, Sugimoto N, Fujita M. Automatic extraction of coronary artery tree on coronary angiograms by morphological operators. Computer in Cardiology 1998; 25: 765-768.
- Maglaveras N, Haris K, Efstratiadis S, Gourassas J, Louridas G. Artery skeleton extraction using topographic and connected component labelling. Computer in Cardiology 2001; 28: 17-20.
- Lara D, Faria A, Araujo A, Menotti D. A semi-automatic method for segmentation of the coronary artery tree from angiography. In: XXII Brazilian Symposium on Computer Graphics and Image Processing (SIBGRAPI) 2009.
- Chaudhuri S, Chatterjee S, Katz N, Nelson M, Goldbaum M. Detection of blood vessels in retinal images using two-dimensional matched filters. IEEE Trans Med Imaging 1989; 8: 263-269.
- Truc PT, Khan M A, Lee YK, Lee S, Kim TS. Vessel enhancement filter using directional filter bank. Comput Vis Image Underst 2009; 113: 101-112.
- Chang JM, Huynh N, Vazquez M, Salafia C. Vessel enhancement with multiscale and curvilinear filter matching for placenta images. In: 20th international conference on Systems, signals and image processing (IWSSIP) 2013.
- Frangi A, Niessen W, Vincken K, Viergever M. Multiscale vessel enhancement filtering. In: Medical Image Computing and Computer-Assisted Intervention (MICCAI’98) Springer LNCS 1998; 1496: 130-137.
- Wink O, Niessen W, Viergever M. Multiscale vessel tracking. IEEE Trans Med Imaging 2004; 23: 130-133.
- Bekkers E, Duits R, Berendschot T, Romeny BH. A multi-orientation analysis approach to retinal vessel tracking. J Math Imaging Vis 2014; 49: 583.
- Rodrigues LC, Marengoni M. Segmentation of optic disc and blood vessels in retinal images using wavelets, mathematical morphology and Hessian-based multi-scale filtering. Biomedical Signal Processing and Control 2017; 36: 39-49.
- Sang N, Tang Q, Liu X, Weng W. Multiscale centerline extraction of angiogram vessels using Gabor filters. Computational and Information Science 2014; 3314: 570-575.
- Rangayyan RM, Ayres FJ, Oloumi F, Oloumi F, Eshghzadeh-Zanjani P. Detection of blood vessels in the retina with multiscale Gabor filters. SPIE Journal of Electronic Imaging 2008; 17: 1-7
- Cruz-Aceves I, Oloumi F, Rangayyan RM, Aviña-Cervantes JG, Hernandez-Aguirre A. Automatic segmentation of coronary arteries using Gabor filters and thresholding based on multiobjective optimization. Biomedical Signal Processing and Control 2016; 25: 76-85.
- Otsu N. A threshold selection method from gray-level histograms. IEEE Transactions on Systems, Man, and Cybernetics 1979; 9: 62-66.
- Kapur JN, Prasanna KS, Andrew KC. A new method for gray-level picture thresholding using the entropy of the histogram. Computer vision, graphics, and image processing 1985; 29: 273-285.
- Doyle W. Operation useful for similarity-invariant pattern recognition. J Assoc Comput Mach 1962; 9:259-267.
- Stauffer C, ve Grimson WL. Adaptive background mixture models for real-time tracking. Proceedings of the IEEE Conf on Computer Vision and Pattern Recognition 23-25 June 1999; Fort Collins.