- Biomedical Research (2015) Volume 26, Issue 4
IIR Filter Order and Cut-off Frequency Influences on EMG Signal Smoothing
Zahari Taha, Abdelhakim Deboucha*, Nizam Uddin Ahamed, Norhafizan Ahmed, Raja Ariffin, Raja Ghazilla#, Anwar PP Abdul Majeed, Yashim Wong
Innovative Manufacturing, Mechatronics and Sports Lab, Faculty of Manufacturing Engineering, University Malaysia Pahang, Kuantan, 26600 Malaysia
#Centre for Product Design & Manufacturing (CPDM), Department of Mechanical Engineering, Faculty of Engineering, University of Malaya, Kuala Lumpur, 50603 Malaysia
- *Corresponding Author:
- Abdelhakim Deboucha
Innovative Manufacturing
Mechatronics and Sports Lab
Faculty of Manufacturing Engineering
University Malaysia Pahang
Kuantan, 26600 Malaysia
Accepted date: June 18 2015
Abstract
Infinite Impulse Response (IIR) filters are the fundamental signal processing technique to analyze the surface Electromyography (sEMG). These filters are defined by their particular orders (e.g. first-, second- or third-order) and the frequency they passed through. Although, EMG signals from human skeletal muscles are important to realize the muscle features, but there is no consistency found in the literature regarding the influence of different orders of the filter and cutoff frequency when processing and filtering EMG signal during lower limb (Biceps Femoris) muscle contraction. It is therefore important to know the response of muscle EMG signal after changing the order of filters and cut-off frequencies. Thus, this paper addresses the behavior of the signal patterns after varying the filter order and cut-off frequency of the filter. To record the EMG signal, one healthy male participated in this study after obtaining his informed consent and the electrodes were placed on the lower limb Biceps Femoris muscle during sit-to-stand task at a normal speed. During the signal processing, the cut-off frequency of the filter was fixed with the variation of the order of the filter. Later, the order of the filter was fixed while the cut-off frequency was varied. Finally, the results show that varying the order of filter (while frequency fixed) does not distort the EMG signal significantly, whereas varying the frequency changes the shape of the signal considerably.
Keywords
Butterworth filter, cut-off frequency, filter order, smoothed signal, sEMG
Introduction
Surface electromyography (sEMG) is a technique used for the quantification of muscle activity during movement [1]. In addition, it is an easy and hassle-free procedure that can be used to determine the timing and the amount of muscle activation throughout a given movement and is an essential tool in biomechanical and biomedical investigations [2,3]. The attribute and the quality of the EMG signal is mainly depend on the various internal structures of the subject, including the individual skin formation, blood flow velocity, skin temperatures, the tissue structure in a layered (i.e. muscle, fat etc.), position of the muscle fibre, and electrodes placement. Therefore, EMG signal is subjected to lose its identity due to the mixing and embedded noises. There are two types of EMG recording processes that are mainly used to record the signals generated by muscle contraction: needle (invasive) and surface (non-invasive) EMG procedures [5,6]. Compared with the needle-based process, the surface EMG sensor (surface electrodes based EMG) is used more frequently because it is preferred by the subjects and because it is a non-invasive and painless technique [4-7]. Based on these advantages of the surface EMG technique, this research work has used surface EMG sensor to record and analyse the EMG signals from the subjects. It is therefore important to understand how well the surface EMG signals of motor units represent the activity of the Biceps Femoris muscle in the upper extremity.
Peter (2005) had reported the application of EMG signals into four corners [8]. One is in the medical research, which includes orthopedic, surgery, and gait and posture analysis. Secondly, is in the ergonomics field where the interactions of human body to the industrial products and work conditions are involved. The third tier is the sports science, such as biomechanics, athletes’ strength training and movement analysis. Lastly, EMG is applicable for rehabilitation and physical therapy. Rehabilitation and physical therapy require a repeated task which maybe not easy to be accomplished by the therapist. Because of these wide applications for EMG, careful analysis is required in term of filtering.
Embedded noises in bio-signals such as electrocardiography (ECG), electroencephalograms (EEG) and sEMG are very common. To reduce the amount of these noises as maximum as possible while retaining the true information of the signal, a variety type of filters and approaches have been extensively developed. Some researchers wondered more on the baseline contaminated noises and artifact on the EMG as a segment to be analysed [9]. Moreover, ECG artifact induced on the sEMG has also been addressed [10,11] using analytical techniques such principal component analysis (PCA) and independent component analysis (ICA). While other researcher attempt to detect only the true peak of the EMG for some purposes [12]. Butterworth filter among the most used IIR filter in sEMG smoothing. For instance, Lenzi et al., and Olree et al., had processed the EMG raw using Butterworth filter at a cut-off frequency of 3Hz and selecting the second order for the filter [13,14]. Then, a full wave rectified EMG was processed using a 4th order Butterworth filter with cut-off frequency of 6Hz by Aguirre- Ollinger et al., [15].
However, still the information and results from the various literatures are not sufficient for sEMG fileting. Thus, the purpose of this investigation is to present how the filter order and cut-off frequency could influence the output of the filter which leads to signal distortion. To accomplish the experiment, raw EMG signal was recorded from subject’s biceps femoris muscle during performing a sit to stand task.
Method
sEMG data recording
Before the experiment, the volunteered subject was informed of the nature and purpose of the study and provided written informed consent. The subject was seated on a standard chair and was asked to rise from the chair at normal speed for five trials. During each trial, the subject was performing two times the sit to stand task successively. In these trials the subject was asked to not use his hands. Electromyographic data were recorded from a pair of surface bipolar electrodes (with a 3-cm interelectrode distance (centre to centre), metallic part: Ag- AgCl; manufacturer: Shenzhen Amydi-med Electronics Tech Co., Ltd.) placed over the relevant muscles connected to a wearable EMG sensor (size: 53 mm x 32 mm x 23 mm, frequency range: 5- 482Hz, max signal range: 4.4 mV, manufacturer: Shimmer Discovery in Motion). The entire protocol and exact placement of the electrodes were followed according to the recommendations of the Surface Electromyography for the Non-Invasive Assessment of Muscles (SENIAM) [16]. The recorded EMG data were sampled at 1024Hz using synchronized biomechanics software [17].
Data analysis
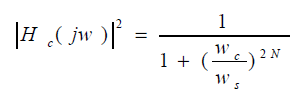
The behaviour of an IIR filter can be summarized by the so-called frequency response function, Hc. The frequency response function of a low-pass Butterworth filter has the following formula
 (1)
(1)
where, ws , wc are the sampling frequency and the cut-off frequency, respectively and N is the filter order. For low pass filter, the inequality ws ?wc has to be satisfied. On the other hand, in time domain, the mathematical recursive model of an IIR digital filter is described by the following deference equation:
 (2)
(2)
with a1, and na = 2,3….., nb = 3,4,5….. are constants. = 1
Fig 1 summarises the stages that have been investigated in this study to filtering the sEMG signal. The first stage was fixing the cut-off frequency and changing the filter order. It should be noted that the Butterworth filter applied here is dual pass (filtering once forward and once backward) to obtain zero-lag filter. The second stage is varying the cut-off frequency while fixing the filter order

Figure 1. Stages for the investigation of the Butterworth filter
Peak Signal to Noise Ratio
Peak Signal to Noise Ratio (PSNR) is a quality measurement that inversely related to signal distortion, that is, its numerical value decreases as the distortion in reconstructed signal increases. Thus, the higher the PSNR, the better is the quality of the compressed or reconstructed signal. The PSNR is calculated using the formula PSNR = 10*log10 ( (max(EMG))/ MSE); where MSE is the mean squared errors given by MSE = Σ ((EMG - FilteredSignal)2))/n.
Result and Discussion
The PSNR was measured when changing the filter order from 1 to 10 and varying the cut-off frequency from 2Hz to 16Hz. PSNR values show slight decrease when fixing the cut-off frequency at 2Hz and varying the filter order from 1 to 7. However, when choosing the filter order at 8 and above at the aforementioned cut-off frequency, the filter became unstable. Increasing the cut-off frequency value to 4Hz, the filter show more robustness up to filter order 9 (Table 1). This means that choosing small cut-off frequency with certain critical points of the filter order result into the signal to be fully distorted. Contrary, when increasing the cut-off frequency with a fixed filter order, the PSNR is increased. That is the signal distortion is less. However, when tuning up both cut-off frequency and the filter order simultaneously, the PSNR increases which means the signal is less distorted. The PSNR values increased rapidly (27.44 (2Hz) to 27.92 (16Hz) see after the first two digit). This means that the shape of the signal could be affected significantly.

Table 1. PSNR Results
Filter Order influence
It is noticeable from figure 2 and figure 3 that when changing the filter order with minor cut-off frequency of 2Hz (left figure), the filter output is significantly affected by the filter order. It is clear that as the order gets higher, the amplitude also gets higher. Figure 3 reveals that when choosing a higher cut-off frequency for instance 6Hz, the filter order does not influences the output filter as it does when the cut-off frequency was 2Hz, it shows almost the same results even changing the filter order with considerable range.

Figure 2. Filter response for different order at cutoff frequency 2Hz

Figure 3. Filter response for different order at cutoff frequency 6Hz
Cut-off frequency influence
From figure 4 and figure 5; when varying the cutoff frequency with fixed filter order, the signal distortion was in all levels of the cutoff frequencies. However, as the cutoff frequency increases as the signal get more noisy.

Figure 4. Filter response for different cutoff frequency at filter order N=3

Figure 5. Filter response for different cutoff frequency at filter order N=3
For more clear view, we separated the graphs with regards to the cutoff ferquency range. Figure 6 (left) where the cutoff frequency varies from 1Hz to 4Hz, results shows considerable difference between the filter outputs. In contrast, Figure 7 shows almost simillar filter outputs when the cutoff frequency range is from 5Hz- 8Hz. Simillar interpretation, when we fixed the filter order at 3 and change the cutoff of freqyency from 1Hz- 14Hz. This means it is better to choose a range where the outputs of the filter are similar.

Figure 6. Filter response for different cutoff frequency at filter order N=6

Figure 7. Filter response for different cutoff frequency at filter order N=6
Conclusions
This paper addressed the influence of the filter order and the cutoff frequency parameters on the output of an IIR Butterworth filter to smooth the sEMG signal, which was recorded from Biceps Femoris muscle. Fixing the filter order and varying the cutoff frequency has shown more signal distortion than when fixing the cutoff frequency and varying the filter order. We can conclude that the filter order has less influence on the filter output com-pared to the influence of the variation of the cutoff frequency. This investigation might`be useful and applicable in assistive devices EMG-based control where the magnitude of the EMG signal is important.
Acknowledgements
The authors thank the volunteer who participated in this study. The authors acknowledge the Ministry of Higher education Malaysia (MOHE) and the Faculty of Engineering, University of Malaya for financial support under HIR-MOHE project UM.C/HIR/MOHE/ENG/41.
References
- Escamilla R. Electromyographic Activity During Upper Extremity Sports Andrews RJ, Kevin EW, Michael RM, editors. USA: Churchill Livingstone; 2008.
- Heinonen I, Nesterov SV, Kemppainen J, Fujimoto T, Knuuti J, Kalliokoski KK. Increasing Exercise Intensity Reduces Heterogeneity of Glucose Uptake in Human Skeletal Muscles. PLoS ONE.2012;7(12):e52191.
- Ahamed NU, Sundaraj K, Ahmad B, Rahman M, Ali MA, Islam MA. Surface electromyographic analysis of the biceps brachii muscle of cricket bowlers during bowling.Australasian Physical & Engineering Sciences in Medicine. 2014;37(1):83-95.
- Pullman SL, Goodin DS, Marquinez AI, Tabbal S, Rubin M. Clinical utility of surface EMG Report of the Therapeutics and Technology Assessment Subcommittee of the American Academy of Neurology. Neurology. 2000;55(2):171-7.
- Mandryk RL, Atkins MS, Inkpen KM, editors.A continuous and objective evaluation of emotional experience with interactive play environments.Proceedings of the SIGCHI conference on Human Factors in computing systems; 2006: ACM.
- Farina D, Negro F. Accessing the neural drive to muscle and translation to neurorehabilitationtechnologies. Biomedical Engineering, IEEE Reviews in. 2012;5:3-14.
- Rodríguez-Carreño I, Malanda-Trigueros A, Gila- Useros L, Navallas-Irujo J, Rodríguez-Falces J. Filter design for cancellation of baseline-fluctuation in needle EMG recordings. Computer methods and programs in biomedicine. 2006;81(1):79-93.
- Peter K. The ABC of EMG–a practical introduction to kinesiological electromyography.Noraxon INC USA. 2005.
- De Luca CJ, Gilmore LD, Kuznetsov M, Roy SH. Filtering the surface EMG signal: Movement artifact and baseline noise contamination. Journal of biomechanics. 2010;43(8):1573-9.
- Chowdhury RH, Reaz MB, Ali MABM, Bakar AA, Chellappan K, Chang TG. Surface electromyography signal processing and classification techniques. Sensors. 2013;13(9):12431-66.
- Willigenburg NW,Daffertshofer A, Kingma I, van Dieën JH. Removing ECG contamination from EMG recordings: A comparison of ICA-based and otherfiltering procedures.Journal of electromyography and kinesiology. 2012;22(3):485-93.
- Xu Z, Xiao S. Digital filter design for peak detection of surface EMG. Journal of Electromyography and Kinesiology. 2000;10(4):275-81.
- Lenzi T, Rossi SMMD, Vitiello N, Carrozza MC. Intention-based EMG control for powered exoskeletons. Biomedical Engineering, IEEE Transactions on. 2012;59(8):2180-90.
- Olree KS, Vaughan CL. Fundamental patterns ofbilateral muscle activity in human locomotion.Biological cybernetics. 1995;73(5):409-14.
- Aguirre-Ollinger G, Colgate JE, Peshkin M, Goswami A, editors. Active-impedance control of a lower-limb assistive exoskeleton. Rehabilitation Robotics, 2007 ICORR 2007 IEEE 10th International Conference on; 2007: IEEE.
- Hermens HJ, Freriks B, Merletti R, Stegerman D, Block J, al.GRe. SENIAM: European recommendations for surface electromyography Roessingh Research and Development, Enschede. http://wwwseniamorg/. 1999.
- Taha Z, Deboucha A, editors. Development of Synchronized Biomechanics Sensors Detection Software. Advanced Materials Research; 2013: Trans Tech Publ.