Research Article - Biomedical Research (2016) Health Science and Bio Convergence Technology: Edition-I
Examining public purchases in the medical field with multiple correspondence analysis
Mustafa Agah Tekindal1*, Ümit Cengiz Uysal2 and M.Özgür Dolgun31Department of Biostatistics and Medical Informatics,Faculty of Medicine, Izmir University, Izmir, Turkey
2State Supply Office of Turkey, The Purchasing Assistant Specialist (Data Scientist), Ankara, Turkey
3Anatolian Research, Business Analytics Team Manager, Ankara, Turkey
- *Corresponding Author:
- Mustafa Agah Tekindal
Department of Biostatistics, Faculty of Medicine and Medical Informatics Izmir University, IZMIR, Turkey
Accepted on April 25, 2016
Abstract
Correspondence analysis is an analysis method that facilitates interpretation of categorical variables in the cross tables (correspondence table, contingency table) as well as the similarities, divergences and associations between the row and column variables, and represents these associations graphically in a lower-dimensional space. It is a method quite popular especially in the fields that require analysis of categorical data such as medicine, health sciences, biometrics, economics, marketing and social sciences. Correspondence analysis has some similarities to the other multivariate methods such as the principal component analysis, log-linear analysis and multi-dimensional scaling. Most purchases by public institutions are determined first 5 items to demonstrate the purchase profile of product in "Hospital Equipment, Furnishings and Equipment" product line in Turkey. These are wheelchairs, companion seats, emergency stretchers, wheeled patient nightstands and examination tables. The compatibility analysis was performed according to purchase frequency and the preferred status in the order cycle of these determined products. In result of multiple correspondence analyses, the explanation ratio of the first two dimensions of the corresponding variable was found to be 97.2%. It is observed that the preferred state of the product type is primary with a ratio of 87% and the number of product order is secondary with a ratio of 10.2%.
Keywords
Multiple correspondence analyses, Homogeneity analyses, Weighted least squares, Biomedical purchase.
Introduction
The developments in the “pharmaceutical industry” and "medical devices industry” give the medical systems industry its strength to possess advanced technologies and to develop and innovate these technologies. Here, it is the medical devices industry that involves differentiation. Medical devices are the key inputs of the medical sector. Therefore, meticulous attention must be paid to the medical devices industry in order to be able to conduct studies on advanced technologies.
Medical industry is one of the fastest-growing industries in Turkey. The industry includes all the state and university hospitals as well as many private hospitals and companies, all functioning under the Ministry of Health. There is a positive correlation between the development levels of countries and their expenditures on public services. Expansion of public services and increase of resources create a potential for the medical industry. In the developed countries, public health spending is expected to increase more rapidly as compared to the annual growth. Therefore, such a positive portrait brings a high growth potential. Espicom-BMI Turkish Medical Industry Report 2013 shows that Turkish medical devices market ranks among the world’s top 20 medical devices and supplies market [1,2]. Based on the demographic indicators, we anticipate that the rates of employment will increase in the forthcoming years together with the medical industry’s place in the national economy improving day by day.
When we look at the historical development of correspondence analysis, we see that it is based on a paper presented by H. O. Hirschfeld in 1935 in which he developed a mathematical formulation of the correlation between the variables of a contingency table. In the 1930s, Richardson, Kuder [3] and Horst [4], independently from each other, proposed some nonmathematical ideas on psychological measurements within the scope of psychometrics. In 1940, R. A. Fisher [5] used the technique proposed by Hirschfeld when analyzing the data relating to hair and eye color in a group of students. Mathematical studies were the ones conducted by Guttman [6] and by Chikio Hayashi [7,8] in Japan; however, these studies led the way to the studies with results presented in numerical form rather than graphical [9].
In France, in the early 1960s, the real impetus to the application of correspondence analysis was given by the studies conducted by Jean Paul Benzécri and his colleagues working at the University of Rennes, and the analysis was improved in the countries where French is spoken widely. These studies by Jean-Paul Benzérci and his colleagues in which correspondence analysis was given a geometric form are considered a real breakthrough [10]. The book by Benzécri originally titled “Analyse des Correspondances” and translated as “I Analyse de Correspondence” (1972) has been a main source of correspondence analysis [11]. The first applications of correspondence analysis incorporating both numerical and geometric results were demonstrated in the studies conducted by Benzécri, who is referred to as the philosopher of data analysis [12]. Various studies were also conducted by Lebart in 1976 and Tabart et al. in 1977 [13]. Due to the complex symbols used by French statisticians and the complex structure of French, the correspondence analysis was hardly known in the English-speaking countries [10]. Especially the studies by M. J. Greenacre contributed a lot to the understanding of the correspondence analysis in the English-speaking countries. Greenacre’s book titled “Theory and Applications of Correspondence Analysis”, which was published in 1984, served a guide to the studies on correspondence analysis. Besides, the correspondence analysis method was extended by many other studies conducted by Hill [14] in 1980, by Nishisato and Rao [15] in 1980, by Gifi [16] in 1981, by Lebart et al. [17] in 1984, by Van der Heijden and de Leeuw[18] in 1985, and by Braak [19] in 1986 [9,10,20].
Material and Methods
In this study, multiple correspondence analysis, which is a widely used method that facilitates easy understanding and correct interpretation of categorical data in the studies conducted in various fields including medicine, biometrics, psychometrics, economics, marketing and social sciences via graphical demonstration, was applied to one of the most important social issues which needs to be paid attention to by the society. In order to demonstrate the purchase profile of products in the product line of "Hospital Equipment, Furnishings and Equipment", the top 5 most purchased items by the public institutions were determined. These are wheelchairs, companion seats, emergency stretchers, wheeled patient nightstands and examination tables. We performed correspondence analysis based on the purchase frequency and the preferred status in the order cycle of these products (Table 1).
| Number of times products are ordered together | |||||||
|---|---|---|---|---|---|---|---|
| 1 | 2 | 3 | 4 | 5 | |||
| 1 | Wheelchairs | 89 | 39 | 20 | 4 | 1 | 153 |
| 2 | Companion seats | 74 | 31 | 18 | 3 | 1 | 127 |
| 3 | Emergency stretchers | 67 | 32 | 16 | 4 | 1 | 120 |
| 4 | Wheeled patient nightstands | 61 | 38 | 17 | 1 | 1 | 118 |
| 5 | Examination table | 64 | 26 | 13 | 4 | 1 | 108 |
| 626 | |||||||
Table 1. Number of times products are ordered together.
The data was obtained from the reports issued by the State Supply Office in 2015. We used IBM SPSS Statistics for Windows (IBM Corp. Released 2013, Version 22.0. Armonk, NY: IBM Corp.) to analyze the data.
Multiple correspondence analysis is the generalization of simple correspondence analysis to the state of the categorical variable Q through the analysis of indicator matrix of data. Assume that the qth variable is category jq, and the sum of categories is J=ΣJ q. When N is the unit, indicator matrix Z becomes a nxJ dimension matrix composed of zeros and ones. In the analysis of the indicator matrix Z, total variation becomes the chi-square statistic that is calculated over Z like a contingency table and is defined as χ2 z =n (J-Q).
The indicator matrix Z is expressed as  . It
indicates the categories
. It
indicates the categories  and the qth categorical
variable. Since the Burt matrix B is symmetric, it can be
showed that the optimal column parameters in the
correspondence analysis of the indicator matrix Z are similar to row or column parameters in the analysis of the Burt matrix B.
The basic inertias of the matrix B (
and the qth categorical
variable. Since the Burt matrix B is symmetric, it can be
showed that the optimal column parameters in the
correspondence analysis of the indicator matrix Z are similar to row or column parameters in the analysis of the Burt matrix B.
The basic inertias of the matrix B ( components) are the
squares of those in the indicator matrix Z. In this way, when B
is found, re-solution can be provided for the columns
(categories) of Z in multiple correspondence analysis. Though
the indicator matrix Z covers the multi-directional information
available in data, it is clear that multiple correspondence
analysis analyzes only bidirectional information. As a result, it
can be said that multiple correspondence analysis is the
weighted least squares approach of the matrix Burt. Chi-square
statistic can be re-calculated for B like a contingency table. It
can be simplified as follows:
components) are the
squares of those in the indicator matrix Z. In this way, when B
is found, re-solution can be provided for the columns
(categories) of Z in multiple correspondence analysis. Though
the indicator matrix Z covers the multi-directional information
available in data, it is clear that multiple correspondence
analysis analyzes only bidirectional information. As a result, it
can be said that multiple correspondence analysis is the
weighted least squares approach of the matrix Burt. Chi-square
statistic can be re-calculated for B like a contingency table. It
can be simplified as follows: 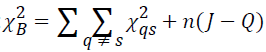 (1)Here,
 is the chi-square statistic for the sub-table
 composed of non-diagonal elements. The measure
of the total variation is
composed of non-diagonal elements. The measure
of the total variation is 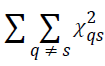 .
.
When a Burt matrix B is given, multiple correspondence analysis can be defined as the least squares approach of B with the lower rank matrix H that minimizes the equation
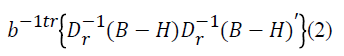
This is the correspondence analysis of the Burt matrix B. Here,
b is the general sum of the matrix B. Dr , on the other hand, is
the diagonal matrix of row and column category rates as the
matrix B is symmetric. Since each Nqs sub-table of the Burt
matrix B is equal to the total number of unit n made into
crosstabs, it can be expressed  . For the variable q,
the vector of the Jq category rates is indicated with rq (1′ r q
=1). This is also a set of the row category rates of N qs for any
s.
. For the variable q,
the vector of the Jq category rates is indicated with rq (1′ r q
=1). This is also a set of the row category rates of N qs for any
s.
Jq × Jq dimension diagonal matrix formed out of the elements of q r is indicated with Dq. In this regard, the equation can be re-written as follows:
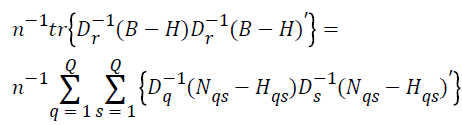 (3)
(3)
Here, H is the supermatrix of Hqs.
In that case,
since  , the equation (3) can
be written in a simpler form as follows:
, the equation (3) can
be written in a simpler form as follows:
The function minimized through this method is
which is the sum of the term
that corresponds to the sub-table constituted by the elements at the top of the diagonal elements of B. The minimization of the equation (3) is equal to the minimization of the noncorrespondence function defined by Healy et al. and the internal consistency criterion set by Nishisato [15,21,22].
Results
Table 2 shows the indicator matrix results. At the end of the analysis of indicator matrix, the rank of the corresponding Burt matrix is 1. In Table 2, the values in the inertia column show the change amounts corresponding to each dimension within the total change (inertia) assessed as the average value of the changes happening on the levels of variables. When these values are examined, it can be seen that each dimension’s contribution is almost close to each other. Their share in explaining the total change of each dimension (percentages) was calculated by comparing each dimension's inertia value with the total inertia value. It was observed that the highest explanation rate is 87% for the first dimension, followed by the explanation rate of 10.2% for the second dimension. These dimensions have a total explanation rate of 97.2%.
| Dimension | Proportion of Inertia | Confidence Singular Value |
||
|---|---|---|---|---|
| Accounted for | Cumulative | Standard Deviation | Correlation | |
| 2 | ||||
| 1 | .870 | .870 | .036 | .070 |
| 2 | .102 | .972 | .041 | |
| 3 | .019 | .991 | ||
| 4 | .009 | 1.000 | ||
| Total | 1.000 | 1.000 | ||
Table 2. The initial matrix analysis results.
Although demonstrating the relationship between the levels of these variables in the two-dimensional space is not sufficient enough to explain the total change, we used only two dimensions to show the interpretation of results and presented the correlation coefficients between the dimensions and levels, the contribution of each level to the dimension and the coordinates in the two-dimensional space in Table 3.
| Overview Column Points | ||||
|---|---|---|---|---|
| y | Mass | Score in Dimension | Inertia | |
| 1 | 2 | |||
| 1 | 0.567 | -0.15 | 0.087 | 0.001 |
| 2 | 0.265 | 0.354 | -0.181 | 0.003 |
| 3 | 0.134 | 0.159 | 0.145 | 0 |
| 4 | 0.026 | -1.197 | -0.697 | 0.004 |
| 5 | 0.008 | 0.008 | -0.374 | 0 |
| Active Total | 1 | - | - | 0.008 |
Table 3. The Central Coordinates of the Categories Belonging to the Variables According to the Dimensions.
Table 3 shows that wheelchair is the product which makes the largest contribution to the 1st dimension. However, when we examine the products of "wheelchair" and "companion seat" together, we can say that they make the largest contribution to the 1st and 2nd dimensions depending on whether they are ordered together, or not. If we show the numerical values in Table 3 in a diagram, the correspondence analysis diagram will be as shown in Figure 1.

Figure 1. Multiple correspondence analysis graph.
Conclusion
Correspondence analysis is preferred as a data reduction and residual analysis due to its ability to give information about the categorical variables and two or more dimensional graphs as well as explaining the lack of homogeneity in row profiles or the dependency (or interaction) between the rows and columns of the cross tables in fewer dimensions [23].
The analysis that to put forth purchasing profile about product range of “Hospital Equipment, Furnishings and Equipment” in Turkey; the most preferred product is wheelchair. Besides As can be seen, the second and third most preferred products are which having almost the same preferred weight "companion seats" and "wheelchair".
On the other hand, we must also add that the "wheelchair" and "companion seat" products preferred together.
The mentioned four the product, taken together probability is very low.
Briefly we can say that in product range of “Hospital Equipment, Furnishings and Equipment” in Turkey the "wheelchair" is a significant and strategic product.
Significant changes occurring in the medical services increase the importance of the medical sector every passing day. Medical devices are indispensable parts of the medical services. The fast-growing and increasingly-important medical devices industry will have a more prominent place in future. Expected human lifespan is gradually increasing. Therefore, as a natural consequence of it, different diseases and needs will emerge in future. In line with this, different product concepts are developed and will continue to be developed. Antipathetic designs of classical medical devices chosen for the end–user products are not welcomed by the patients and their caregivers. In recent years, products have been offered in various types based on personal preferences using user-centered, aesthetically pleasing, practical and easy-to-use designs. In today's competitive environment, large companies that produce high-tech devices should use designs that can best reflect the technological features of the devices. In this study, we tried to demonstrate the purchase profile of products in the product line of "Hospital Equipment, Furnishings and Equipment" in Turkey. It would be best for the large companies that produce high-tech devices to develop a profile for future taking into account the profile in this study.
Acknowledgement
The study was presented as a poster presentation as follows identifier. Uysal Ü.C., Tekindal M.A., Dolgun M.Ö, Investigation With Multiple Correspondence Analysis Of The Public Procurement In The Medical Field In Turkey, The 8th Conference of Eastern Mediterranean Region of International Biometric Society 11-15 May 2015, Cappadocia, Nevsehir, Turkey, Poster Presentation, P. 153
References
- Sağlık Bakanlığı TC, Yıllığı SI. Editörler: Köse RM, Başara BB, Güler C, Yentür KG. Türkiye Cumhuriyeti Sağlık Bakanlığı, Sağlık Araştırmaları Genel Müdürlüğü, Ankara: Sentez Matbaacılık ve Yayıncılık, 71-84.
- Hirschfeld HO. A Connection between Correlation and Contingency. Mathematical Proceedings of the Cambridge Philosophical Society 1935; 31: 520-524.
- Richardson MW, Kuder GF. Making a rating scale that measures. Personnel Journal 1933; 12: 36-40.
- Horst P. Measuring Complex Attitudes. J Social Psychol 1935; 6: 369-374.
- Fisher RA. The Precision of Discriminant Functions. Ann Eugen 1940; 10: 422.429.
- Guttman L. The Quanti_cation of a Class of Attributes: A Theory and Method of Scale Construction. The Prediction of Personal Adjustment. 1941; Social Science Research Council, New York.
- Chikio H. Multidimensional quantification, I Proc Japan Acad 1954; 30: 61-65.
- Kumiko M, Chikio H. Data analysis with response errors. Japanese Journal of Psychology 1968; 38: 297-310.
- Greenacre MJ. Practical Correspondence Analysis. Interpreting Multivariate Data. 1981; John Wiley & Sons Ltd, 119-146.
- Suner A, Çelikoğlu CC, Uygunluk Analizinin Benzer Çok Değişkenli Analiz Yöntemleri Ile Karşilaştirilmasi, İstatistikçiler Dergisi 2008; 9-15.
- Benzécri JP, L’Analyse des Données. tome 1 : La Taxinomie, tome 2 : l’Analyse des correspondances , Dunod, Paris.
- Greenacre MJ. Theory and Applications of Correspondence Analysis 1984; London: Academic Press Inc.
- Lebart L. The significancy of eigenvalues issued from correspondence analysis. Proc Comp Statist, Vienna: Physica Verlag 1976; 38-45.
- Hill MO, Gauch HG. Detrended Correspondence Analysis: An Improved Ordination Technique Vegetatio 1980; 42: 47-58.
- Nishisato S. Analysis of categorical data: Dual scaling and its applications. 1980; Toronto: University of Toronto Press.
- Gifi A. Nonlinear Multivariate Analysis, New York, John Wiley&Sons.
- Lebart L, Morineau A, Warwick KM. Multivariate Descriptive Statistical Analysis. New York 1984; J Wiley.
- Heijden V, de Leeuw PGM. Correspondence analysis used complementary to loglinear analysis. Psychometrika 1985; 50: 429-447
- Ter Braak CJF. Canonical correspondence analysis: A new eigenvector technique for multivariate direct gradient analysis. Ecology, 1986; 67: 1167-1179.
- Clausen SE. Applied Correspondence Analysis: An Introduction, Sage Publications Inc 1998; USA.
- Cangür Ş, Sığırlı D, Ediz B, Ercan İ, Kan İ, Türkiye’deki Özürlü Grupların Yapısının Çoklu Uyum Analizi ile İncelenmesi, Uludağ Üniversitesi Tıp Fakültesi Dergisi 2005; 31: 153-157.
- Greenacre MJ. Correspondence analysis of multivariate categorical data by weighted least-squares. Biometrika 1988; 75: 457-467.
- Higgs NT. Practical and innovative uses of correspondence analysis. The Statistician 1990; 40: 183-94.