Research Article - Biomedical Research (2017) Volume 28, Issue 2
Evaluation of expected and perceived of quality of service with the SERVQUAL scale: The case of a private physical therapy and rehabilitation center
Özlem Güllü1*, Melike Tekindal2, Mustafa Agah Tekindal3, Ayşe Canan Yazıcı31Department of Biostatistics, Faculty of Sciences, Ankara University, Turkey
2Department of Social Work, Faculty of Health Sciences, Izmir Katip Çelebi University, Izmir, Turkey
3Department of Biostatistics and Medical Informatics, Faculty of Medicine, Izmır University, Turkey
- *Corresponding Author:
- Özlem GÜLLÜ, Dr.(PhD)
Department of Statistics, Faculty of Sciences
Ankara University, Ankara, Turkey
E-mail: ozlem.gullu@gmail.com
Accepted date: June 15, 2016
Abstract
Purpose: Quality of service is one of the important factors that influence the success of enterprises operating in the health sector. Besides enterprises providing products, the enterprises providing services are also affected by competition in today’s world, in which competition increases rapidly and competition conditions become more difficult every day. Therefore, it can be said that increasing quality of service is one of the ways of gaining a strategic competitive advantage.
Subjects and Methods: This study was conducted on patients receiving service from a private physical therapy and rehabilitation centre located Ankara, Turkey. The SERVQUAL scale, which measures quality of service, was used in the study. An attempt was made to evaluate the quality of the service provided by the private physical therapy and rehabilitation center based on the expectations of the center’s customers. The research sample consisted of 122 patients receiving services at Kuantum Physical Therapy and Rehabilitation Center.
Results: The obtained results indicated that in private physical therapy and rehabilitation center, physical appearance represents an important dimension of the quality of service. Although the patients received higher quality service in terms of this dimension than they expected, the expectations of the patients related to the sensitivity of dimension were not satisfied.
Conclusion: The study also showed that sociodemographic characteristics such as level of income and level of education, reasons for choosing the private physical therapy and rehabilitation center and the patients’ pretreatment and posttreatment daily lives are influence the perceived quality of service and each dimension of quality.
Keywords
Quality of service, Physical therapy and rehabilitation center, SERVQUAL method.
Patient satisfaction, which is one of the important outcomes of healthcare service delivery, is an important guide to improve quality in the health sector. Patient satisfaction research carried out to achieve patient satisfaction is important to determine the degree to which the expectations of patients are fulfilled and to assess healthcare service delivery. The World Health Organization (WHO) defines quality of life (QoL) as an individual's perception of their position in life in the context of their culture and value systems in which they live and relation to their goals, expectations, standards and concerns. It is a broad concept complexly affected by a person's physical health, psychological state, personal beliefs, social relationships, and relationship with environmental features [1].
As there have been changes in the field of health and the scope of health insurance has been widened in Turkey, branch centers, which are private centers, have started to occupy a significant place. In this regard, the present study deals with the quality of service provided by physical therapy centers. Physical therapy and rehabilitation services in Turkey are provided by both government and private physical therapy centers. The purpose of these health centers is to improve the quality of life where needed in of people living in rural or urban areas [2,3]. Healthcare organizations have turned to diversifying their services in order to continue their existence and remain open. As a result, they have had to attach more importance to quality of service. According to Known and Kim, patient satisfaction is influenced by the physical area of the health center, waiting time, and cost [2,3].
Disabilities or physical activity limitations are important determinants of quality of life. These factors impact quality of life and decrease it. Hence, physical therapy and rehabilitation centers provide important services that improve the individual's quality of life [4].
The literature contains definitions of quality of service that are similar to one another. According to Kotler and Armstrong, a service is an activity or benefit that cannot be touched, does not result in the possession of anything, and does not necessarily depend on a physical product [5]. Perceived quality of service is generally associated with the satisfaction levels of those who receive it (i.e., consumers) and is defined as their opinions about the superiority or excellence of a product or a service [6,7]. However, it is quite difficult to define the quality expectation of a consumer. It does not have a single definition. Attempts have been made to define it from two different points of view: (1) quality that is desired and accepted by consumers [8,9] and (2) the expectations of consumers before they benefit from services and their perceptions after they benefit from them [10]. This the quality expectation of a consumer being the case, may vary by sector, time, context, and personal characteristic. This is why the concept of perceived quality of service has been focused on in many fields in the literature [11-16].
Parasuraman et al. suggested that there are 5 dimensions of the quality of service that are applicable to all service sectors [16]. These dimensions are tangibles, reliability, responsiveness, assurance, and empathy. According to Parasuraman, Zeithaml, and Berry [17], these five dimensions of quality of service constitute a framework and can be adapted to other service types when required.
When the primary purpose served by these analyses and assessments of the quality of service is questioned, what comes to mind is the social work profession. This is because the basic concepts of the social work profession are human rights and social justice. In this respect, the primary duty of social work experts working in the field of health is to improve the quality of service received by patients. Social workers may come up with individual, organizational, and social recommendations. When the results of these studies are reported to the public and managers, the quality of service may be increased, and services may be accessed more easily and justly.
In this sense, the study aims to examine the quality of service provided by a private physical therapy and rehabilitation center located in the provincial center of Ankara, Turkey, and to evaluate patient satisfaction there with the SERVQUAL scale.
Subjects and Methods
SERVQUAL was developed by Parasuraman, Zeithmal, and Berry in the United States of America in 1990. SERVQUAL is a measurement method that argues the key to achieving excellent quality of service is fulfilling the expectations of customers absolutely or going beyond these expectations. If services fulfill the expectations of customers, there will be either no difference or a very small difference between perceptions and expectations. Based on the research of Ekmekçioglu, Zeithaml, Parasuraman and Berry [18,19], ten determinants of quality of service were determined. Then Parasuraman et al. [16] evaluated questionnaires they administered via factor analysis and reduced ten determinants of the quality of service to five determinants. In this way, they developed SERVQUAL, which is a measuring tool for assessing quality of service. These five dimensions are tangibles, reliability, responsiveness, empathy, and assurance.
In the present study, loyalty was added to the dimensions of SERVQUAL. Loyalty is an emotional bond between a customer and an establishment that is formed after the customer is completely satisfied with the services provided by the establishment. This hypothesis of the study is as follows:
H0: There is no significant difference between customer expectations and perceptions of the services.
H1: There is significant difference between customer expectations and perceptions of the services.
Based on the obtained factors, the SERVQUAL score was calculated as follows:
SERVQUAL score (SQ)= perceptions score (a) - expectations score (b)
The mean SERVQUAL score was calculated for each dimension (k refers to the number of dimensions) by using the SERVQUAL scores. Mean SERVQUAL scores (SQMs) were obtained in two stages.
• For each customer, the SERVQUAL scores assigned to statements about the related dimension were added up, and the result was divided by the number of the statements for this dimension.
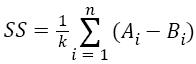 →(4.1)
• For n customers, the numbers obtained in the first step were added up, and the result was divided by the sample volume.
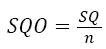 →(4.2)
To find the total quality of service score (TQSS), the scores calculated for the dimensions were added up, and the result is divided by the number of the dimensions. This was the found is unweight SERVQUAL score.
 →(4.3)
A questionnaire was administered to 122 patients receiving services at a physical therapy and rehabilitation center (PTRC). In this questionnaire, the SERVQUAL scale developed by Parasuraman, Zenithal, and Berry [16] was used. The questionnaire consisted of two parts: (1) assessment of the demographic characteristics of the patients and (2) assessment of expectations and perceptions through the SERVQUAL scale. The first part contained demographic questions about gender, age, income status, educational status, and so on while the second part was made up of 5-point Likert-type scale questions (1- strongly disagree; 5 strongly agree). There were two groups of questions in this part: perceptions and expectations. There were 26 question propositions in this part. The obtained data were analyzed through Cronbach’s alpha for reliability analysis, the independent two-sample t-test (Student’s t test) for comparison between two groups, and the Mann-Whitney U test when prerequisites were not fulfilled. For the comparison of three and more groups, one-way analysis of variance (ANOVA) and Tukey’s HSD test, which is a multiple comparison test, were used. When prerequisites were not fulfilled, the Kruskal-Wallis test and Bonferroni- Dunn test, which is a multiple comparison test, were used. The level of significance was 0.05 for all analyzes. The data were evaluated using IBM SPSS Statistics 20 (IBM Corp. Released 2011. IBM SPSS Statistics for Windows, Version 20.0. Armonk, NY: IBM Corp.).
Results
In a reliability analysis, Cronbach’s alpha coefficients are calculated that are used to indicate the reliability of tools based on scales (Likert scale, q-type scale) built upon total scores. The closer the Cronbach’s alpha coefficients are to 1, the more reliable the scale is. Thus, the overall scale and the dimensions of the scale can be deemed reliable.
The participating patients, 42.6% were female, and 57.4% were male. The 16-25 age group, 14.8% in the 26-35 age group, 23.8% in the 36-45 age groups accounted for 6.6%, 14.8%, 23.8%, 29.5%, and 25.4% of the participants, respectively, and 4.1% of the participants were illiterate. Primary school graduates, secondary school graduates, and university graduates accounted for 39.3%, 26.2%, and 30.3% of the participants, respectively, and 13.1%, 23.8%, 26.2%, 13.1%, and 23.8% of the participants had monthly incomes of less than TL 600, TL 601 to 1000, TL 1001 to 1400, TL 1401 to 1800, and over TL 1800 respectively. Furthermore, 38.5%, 7.4%, and 53.3% of the participants were registered in a retirement fund, social security organization for artisans and the self-employed, and social security institution, respectively. Finally, 86.1% of the participants stated that their expectations from the treatment were fulfilled, while 13.62% told that their expectations were not fulfilled.
The highest score for patient perception regarding the services provided by the center was obtained for the 1st item of the SERVQUAL question proposition, which was associated with the dimension of tangibles (“The PTRC has a modern building and working areas”), while the lowest score for patient perception was obtained for the 24th item of the SERVQUAL question proposition, which was associated with the dimension of loyalty (“Physical therapy and rehabilitation sessions should be attended regularly”). A statistically significant difference was found between the patients’ expectation and perception means in the t test, which was carried out to determine whether or not there was a significant difference between the patients’ expectation and perception means.
On the basis of the dimensions of quality, most of the perceived quality of service scores of the PTRC was positive. Thus, it can be said that the service provided by the PTRC fulfilled the expectations of the patients on the basis of the dimensions.
According to Table 1, statistically significant differences were found between the expectations and the perceptions of the patients regarding the quality of service provided by the PTRC in the dimensions of tangibles and empathy. The differences found in other dimensions were not statistically significant. These differences occurred incidentally. On the other hand, the perceptions of the patients were higher than their expectations in the dimension of tangibles, and they were satisfied with the service they received in this dimension. Contrary to this, the expectations of the patients were not fulfilled in the dimension of empathy, and thus they had low perceptions regarding the service of the PTRC in this dimension.
| Expected | Perceived | Difference | |
|---|---|---|---|
| Tangibles (n=4) | 1.238± 0.487 | 1.393± 0.537 | 0.156± 0.505* |
| Reliability (n=5) | 1.200± 0.516 | 1.228± 0.404 | 0.028± 0.433 |
| Responsiveness (n=5) | 1.226± 0.549 | 1.259± 0.445 | 0.033± 0.506 |
| Empathy (n=4) | 1.381± 0.637 | 1.299± 0.470 | -0.082± 0.463* |
| Assurance (n=4) | 1.203± 0.474 | 1.248± 0.407 | 0.045± 0.362 |
| Loyalty (n=4) | 1.240± 0.551 | 1.246± 0.492 | 0.006± 0.417 |
Table 1: T test and descriptive statistics concerning the dimensions of quality of service and differences.
SERVQUAL scores calculated on the basis of the dimensions of tangibles, reliability, responsiveness, empathy, assurance, and loyalty are indicated as SQ1, SQ2, SQ3, SQ4, SQ5, and SQ6 respectively.
The analysis of results showed that there were no statistically significant differences at the 0.05 significance level between the mean SERVQUAL scores of the patients in terms of age, sex, working status, social security, body part treated, level of pain before and after treatment, and expectation from treatment.
According to analysis of variance (ANOVA) results of the SERVQUAL scale regarding educational status, there was a statistically significant difference between the means of the patients in the dimension of assurance by educational level. The analysis showed that the patients with a lower educational level had a higher perception of the quality of service in comparison with the patients with a higher educational level.
According to analysis of variance (ANOVA) results of the SERVQUAL scale regarding income level, the analysis of variance, which was performed to see whether or not the SERVQUAL scores of the patients varied by income level, showed that the patients who had a monthly income of TL 1401 to 1800 had higher perceptions of the quality of service in comparison with those who had a monthly income of TL 601 to 1000 or TL 1001 to 1400.
According to analysis of variance (ANOVA) results of the SERVQUAL scale regarding the number of working people in the family, analysis of variance, which was performed to see whether or not the SERVQUAL scores of the patients varied in the dimension of loyalty by the number of working people in the family, showed that the patients who had 1 or 2 working people in the family had lower perceptions of quality of service in comparison with those who had 3 or 4 working people in the family.
According to analysis of variance (ANOVA) results of the SERVQUAL scale regarding the reason for choosing the establishment, there was a statistically significant difference at the 0.05 significance level between the mean scores of the patients in the dimensions of tangibles, reliability, and responsiveness by reason for choosing the PTRC. The patients choosing the PTRC upon the recommendation of their doctors had higher expectations regarding the quality of service in comparison with those choosing it for other reasons.
A statistically significant difference was found between the levels of aches suffered by the patients in daily life before and after treatment.
Discussion
In this study, an attempt was made to investigate the expectations and perceptions of patients receiving service from a physical therapy and rehabilitation center regarding the center and the services they received from it.
It can be said in general that the physical therapy and rehabilitation center did not fulfill the expectations of the patients because no significant difference was found in the dimensions of quality of service except for tangibles and empathy. This is supported by research in the literature, too. Taş [20] carried out a quality of service survey on public and private branch hospitals and concluded that the expectations of people were higher than their perceptions. Likewise, Rahman et al. [17] also reported that the perceived quality of service was lower than expectations. The quality of service is below expectations in physical therapy centers or hospitals. On the other hand, in the present study, the highest score for perception was observed in the dimension of tangibles, which includes physical facilities and equipment used in providing services and the appearance of personnel. In the case of physical therapy centers, this dimension refers to the external appearance of the building, its internal order, the layout of treatment rooms, the appearance of the personnel of the center (i.e., clothing, smiling face), and the availability of equipment. In this regard, it can be said that the PTRC examined in the present study greatly fulfilled the expectations in this dimension.
Contrary to the dimension of tangibles, the perceived quality of service was far below expectations in the dimension of empathy, which refers to establishments empathizing with consumers and giving individualized attention to them. In a physical therapy center, this dimension involves the ability to listen to and understand patients. PTRCs should endeavor to improve in terms of this dimension. “Empathy” skills should be featured for personnel who are in a one-to-one relationship with patients. This is because when one of their patients has a problem or need, the patient contacts them first. If their relationship is not based on patient rights, the perceived quality of the center will definitely decrease. As a matter of fact, in the present study, the scale item for which expectations were fulfilled at the lowest level was “Professionals give close attention to patients in the PTRC.” This means that the personnel did not give attention to the patients.
The educational status of the patients had an influence on their perceptions regarding the dimension of assurance within the scope of the overall quality of service of the PTRC. The patients having lower educational levels found the center more assuring. Likewise, monthly income level influenced the dimension of assurance, too.
To sum up, the managers of physical therapy and rehabilitation centers should set some targets to enhance quality of service based on customer expectations. This is because the expectations regarding empathy in particular require focusing on plans and programs in this matter.
It is said that limitations of this study small number of samples and inclusion of a private health center.
If the managers of physical therapy and rehabilitation centers gain a competitive advantage by seeking to provide a service that has a quality higher than the expectations of patients in today’s rapidly changing and developing world, they may have and sustain a better position in the health sector. The SERVQUAL scale has not been applied for the PTRC before. In this respect, this study will provide guidance for PTRC administrators. At the same time that it can be used for different sectors and employees, manage and individuals who benefit from the service of satisfaction to improve the policies will contribute to development.
Acknowledgements
The study was presented as a poster presentation as follows identifier: Güllü Ö, Tekindal M., Tekindal M.A., Yazıcı A.C., Measuring The Quality Of Service In The Health Sector Through Servqual Method: The Case Of A Physical Therapy And Rehabilitation Center, The 8th Conference of Eastern Mediterranean Region of International Biometric Society 11-15 May 2015, Cappadocia, Nevsehir, Turkey, Poster Presentation, P. 164.
References
- Senany AS, Saif AA. Assessment of physical health status and quality of life among Saudi older adults. J PhysTherSci, 2015; 27: 1691-1695.
- Known MJ, Kim SH. A survey of satisfaction of physical therapy patients in Kwang-Ju. KAPT, 2003; 15: 185-194.
- Lee HS, Jong SC, Yong HK. Awareness of community-based rehabilitation with a focus on public health centers. J PhysTherSci; 2011; 23: 909-913.
- Jun HJ, Kim KJ, Chun IA. The relationship between stroke patients’ socio-economic conditions and their quality of life: the 2010 Korean community health survey. J PhysTherSci 2015; 27: 781-784
- Kotler P, Armstrong G. The Principles of Marketing New Jersey: Prentice Hall, 1996;pp: 245-246.
- Zeithaml VA, Parasuraman A, Berry LL. Delivering Quality Service: Balancing Customer Perceptions and Expectations. New York: The Free Press, 1990; pp: 15.
- Aksaraylı M, Saygın Ö. Algılananhizmetkalitesivelojistikregresyonanaliziilehizmettercihineetkisininbelirlenmesi [Perceived service quality and determination of the effect on service preference with logistic regression analysis], DokuzEylül University Journal of Institute of Social Studies, 2011; 13: 21-37.
- Rust RT, Zahorik AJ, Keiningham TL. Return on Quality (ROQ): Making Service Quality Financially Accountable. J Marketing 1995; 59: 58-70.
- Aksoy R.Zonguldak’taAyaktaTedaviTüketicilerininSağlıkHizmetiKaliteDeğerlemesi [Medical Service Quality Evaluation of Outpatient Treatment Consumers in Zonguldak]. ZonguldakKaraelmas University Journal of Social Sciences 2005; 1: 91-104.
- Teas RK. Expectations, Performance, Evaluation and Consumers Perceptions of Quality. J Marketing 1993; 57: 18-34.
- Parasuraman A, Zeithaml VA, Berry LL. A Conceptual Model of Service Quality and Its Implications for Future Research. J Marketing 1985; 49: 41–50.
- Carman JM. Consumer Perceptions of Service Quality: An Assessment of the SERVQUAL Dimensions. Journal of Retailing, 1990; 66: 33-55.
- Yavaş U, Bilgin Z, Shemwell DJ. Service Quality in the Banking Sector in an Emerging Economy: A Consumer Survey. IJBM 1997; 15: 217-223.
- Lim PC, Tang N. Study of Patients’ Expectations and Satisfaction in Singapore Hospitals. IJHCQA, 2000; 13: 290-999.
- Kara A, Lonial S, Tarim M, Zaim S. A Paradox of Service Quality in Turkey: the Seemingly Contradictory Relative Importance of Tangible and Intangible Determinants of Service Quality. EBR, 2005; 17: 301-310.
- Parasuraman A, Zeithaml VA, Berry LL.Servqual: A Multiple Item Scale for Measuring Customer Perceptions of Service Quality. Journal of Retailing 1988; 64: 12-40.
- Rahman S, Erdem R, Devebakan N.Hizmetkalitesinin SERVQUAL ölçeğiiledeğerlendirilmesi: Elazığ’dakihastanelerüzerinebirçalışmaAssessing the quality of service through the SERVQUAL scale: a study on hospitals in Elazığ. DokuzEylül University Journal of Institute of Social Sciences, 2007; 9: 37-55.
- Ekmekçioğlu S. Müşterimemnuniyeti, ölçülmesivedeğerlendirilmesi [Assessment and evaluation of customer satisfaction. Unpublished master’s thesis, Marmara University, Institute of Social Sciences, 2003; pp 28.
- Zeithaml VA, Parasuraman A, Berry LL. A Conceptual Model Of Service Quality and Its Implications for Future Research. J Marketing 1985; 49: 41-50.
- Taş D.SağlıkHizmetKalitesininÖlçümüneİlişkinBirAraştırma. A Study on the Assessment of the Quality of Healthcare Service]. SağlıktaPerformansveKaliteDergisi. The Journal of Performance and Quality in Health; 2011, 4: 79-102.