- Biomedical Research (2013) Volume 24, Issue 2
Estimation of Amino Acid Requirement Adjusting for Carry-Over Effect Based on Approximate Change-Point Regression Model.
Mai Kato1*, Satoshi Hattori2 and Kohsuke Hayamizu31Kurume University Graduate School of Medicine and Biostatistics Department., Janssen Pharmaceutical K.K., 5-2 Nishi-kanda 3-chome, Chiyoda-ku, Tokyo 101-0065, Japan
2Biostatistics Center, Kurume University, 67 Asahi-machi , Kurume, Fukuoka 830-0011, Japan
3Human Life Science R & D Center, Nippon Suisan Kaisha Ltd., 2-6-2 Otemachi, Chiyoda-ku, Tokyo 100-8686, Japan
- *Corresponding Author:
- Mai Kato
Kurume University Graduate School of Medicine and
Biostatistics Department.
Janssen Pharmaceutical K.K., 5-2 Nishi-kanda 3-chome
Chiyoda-ku, Tokyo 101-0065, Japan
Accepted date: January 27 2013
Abstract
It is an important issue to determine amino acid requirement in human in nutritional science. The indicator amino acid oxidation technique is often employed to the issue. An indicator amino acid is measured repeatedly from each participant at intake of various dosage of the target amino acid to determine the requirement. Change-point models are often employed to determine the requirement. Carry-over effects due to repeated measurement may influence on estimation of the change-point. In this paper, a model is introduced to evaluate the carry-over effect and to estimate the change-point adjusting for the carry-over effect. A simple inference procedure is introduced based on an approximation of the change-point model. It can be easily executed using a standard software for the non-linear mixed effect models. We apply the model to a dataset analyzed in a previous study to estimate the requirement of lysine in human. A simulation study is also conducted to evaluate the performance of the proposed method with small sample size.
Keywords
Indicator amino acid oxidation technique, Indispensable amino acid, Non-linear mixed effect model, Washout period
Introduction
In nutritional science, the determination of amino acid requirement in humans has been of surging interest and importance [1-4]. The amino acid requirement is needed in order to support activities such as the determination of food and nutrition adequacy of population food intakes, setting of national food and nutrition guidelines by countries worldwide [5]. One of major methods to estimate amino acid requirement in human is indicator amino acid oxidation (IAAO) technique, based on the concept that when the target amino acid does not reach at the required level, in another word, is limiting protein synthesis, other amino acids in excess must be, therefore oxidized. This is because amino acid cannot be stored and therefore as the dietary amount of the target amino acid is increased, the other (indicator) amino acid is used more for protein synthesis and the oxidation of the indicator amino acid decreases until the requirement of the target amino acid is reached at sufficient level. By using this characteristic of amino acid, the IAAO method is designed to determine the requirement of a target amino acid. The IAAO is inversely related to protein synthesis and the inflection point where the oxidation of the indicator amino acid stops decreasing and reaches a plateau is referred to as the change-point, where the requirement of the target amino acid is reached is at which protein synthesis is maximized and thus the oxidation of the indicator amino acid is minimized. Zello et al [6] reported a study to determine the requirement of lysine. Phenylalanine, an indicator amino acid was evaluated by collecting expired breath. 13CO2 samples, which were not used for protein synthesis, repeatedly for each participant with various dosage of the target amino acid (lysine). A change-point model to estimate the requirement of lysine was applied [6]. As summarized in next section, phenylalanine was repeatedly measured and thus the observations within a participant should be regarded as statistically dependent. Another issue arising from repeated measurement is carry-over effect. Estimate of the change-point may be influenced by carry-over effect due to an insufficient washout-period. To the best of our knowledge, the influence of carry-over effect have not been accounted for in previous studies for amino acid requirement [1,3].In medical studies such as crossover trial for bioequivalence of pharmacokinetics, carry-over effects are often discussed [7,9]. Model-based adjustment of carry-over effects have been often applied [8,9]. In most of the literatures dealing with model-based adjustment of the carry-over effect, effects of the carryover are incorporated in the analysis of variance models. However, such an approach based on linear regression does not seem to be a natural approach for the estimation of a change-point. In this paper, we propose a model to estimate the amino acid requirement adjusting for the carry-over effect. We introduce a simple inference procedure based on an approximate change-point model. Statistical inference based on maximum likelihood theory is utilized to make inference of the change-point. Our method can be conducted with a standard statistical software package for the non-linear mixed effect model such as NLMIXED procedure of SAS (SAS Institute inc., Cary, NC) and nlme function in S-plus (Mathematical Systems inc., Tokyo) and R and thus has a potential of wide use for determining amino-acid requirement.
Materials and Methods
Lysine requirement study
We provide a brief summary of the study conducted by Zello et al. [6]. Following the IAAO framework, the study was designed to determine the requirement of indispensable amino acid, lysine in healthy adult humans using L-[1-13 C] phenylalanine as an indicator amino acid. Seven participants were enrolled in the study. The study consisted of two parts. In the first dietary period (series 1), the participants received an intake of the target amino acid at day 3, 6, and 9. After a washout period of at least 14 days, the second dietary period (series 2) started and the participants received an intake at day 3, 6 and 9 again. Each participant received six different dosage of seven lysine intakes (5, 10, 20, 30, 40, 50 and 60 mg/kg/d) and the order of doses were determined by a Latin square. Phenylalanine oxidations at each lysine intake and order of dosage of lysine intake were presented in Table 7 and 3 of Zello et al.[6] respectively. Zello et al [6] applied a change-point regression model by using the estimating method presented in the section 6.5 of Seber and Lee [10]. The change-point was estimated as 36.9 mg/kg/d with the 95% confidence interval (CI): [-0.041, 0.040] by Fieller's method.
Change-point regression model and approximate inference
Let yij and xij be the measurement of L-[1-13C] phenylalanine and the dose of lysine at the jth intake of lysine. Individual profiles of phenylalanine over dosage of lysine intake are presented (Fig. 1). As outlined in the previous section, the participants received lysine repeatedly [6]. In each series, dosage of lysine at day 3 may influence the measurement of phenylalanine oxidation at day 6 if 3 days interval of dosage is not enough for washout period. Similarly the measurement at day 9 may be influenced by the amount of lysine intake at day 6 and at day 3. We here introduce a model taking into account the influence of previous dosages of lysine. Let xij* be the actual dose of lysine in the ith participant's body at the jth intake of lysine and xij be the dose at the jth intake. Define wij(-3) and wij(-6) as the dose at three days and six days before the jth intake respectively; (wi1(-3), wi1(-6))=(0, 0), (wi2(-3), wi2(-6))=( xi1, 0), (wi3(-3), wi3(-6))=(xi2, xi1), (wi4(-3), wi4(-6))=(0,0), (wi5(-3), wi5(-6))=(xi4,0) and (wi6(-3), wi6(-6))=(xi5, xi4). The order of the intake is given in Table 3 of Zello et al.[3]. Between xij and xij*, a structural model xij*= xij +f-3 wij(-3) + f-6 wij(-6) (Eq1) is considered. Parameters f-3 and f-6 are regarded as a rate of dosage of intake at three days and six days before the jth intake accumulating in body at jth intake of lysine respectively.

Figure 1: Effect of lysine intake on production of 13CO2 from the oxidation of L-[1-13C] phenylalanine (F13CO2) [1]. Illustrated is the oxidation response of phenylalanine at varying dietary intakes of lysine.
We consider the following change-point model, for i=1,2, …,N and j=1,2, …, J, where J denotes the number of lysine intake, N is the number of participants and I(xij* < xcp) = 1 if xij *<< xcp and 0 otherwise. Fixed effects are m, m and xcp, and bi is a random effect following a normal distribution with mean 0 and variance α2b. A random error eij follows a normal distribution with mean 0 and variance α2 and bi and eij are assumed statistically independent.

In the model (Eq2), multiple unknown parameters are included in the indicator function. Thus it seems difficult to apply the formerly-used methods [10]. One may employ the maximum profile likelihood method [11,12]. However it is difficult to obtain a confidence interval even with the profile likelihood method.
We propose an approximate inference procedure. We introduce
a model Suppose m < 0. If xij*<xcp, exp{m(xij*-xcp)}>>1 and
then the model (Eq3) provides an approximation 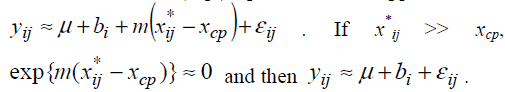 .
.
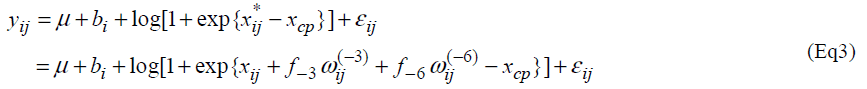
Therefore the model (Eq3) is expected to approximate the model (Eq2). If the model (Eq3) approximates the model (Eq2) well, one can estimate unknown parameters of the model (Eq2) by maximum likelihood method based on the model (Eq3). The model (Eq3) is a special case of the standard non-linear mixed effect models [13] and unknown parameters in the model (Eq3) can be easily estimated by using standard software packages for nonlinear mixed effect models such as NLMIXED procedure in SAS and nlme function in S-plus and R. Confidence intervals are obtained following the standard asymptotic theory of the maximum likelihood estimation [13].
The mean functions of the model (Eq2) and that of the model (Eq3) are plotted with m=- 0.1 (A) and m=- 0.5 (B) (Fig. 2). These plots indicate that the appropriateness of approximation of the model (Eq3) to the model (Eq2) depends on the absolute value of m; if the absolute value of m is not sufficiently large, the approximation may be poor. By multiplying some positive constant to yij, the absolute value of m can be large. By the transformation, the parameters xcp, f-3 and f-6 do not change. Based on this property, we propose to apply the model (Eq3) after multiplying a large positive constant ρ to yij.

Figure 2: Mean profiles of the change-point model (Eq2) and the approximate change-point model (Eq3) with m = −0.1 (A) and m = −0.5 (B).
Results
The results of statistical analyses of lysine data are presented. We fit the model (Eq3) with sufficiently large ρ for estimation to have better approximation. Fitted mean functions over dosage of lysine based on the model (Eq3) and that of corresponding the model (Eq2) with ρ=1 and ρ=3 are presented (Fig. 3).with observations of a participant (idno=3 as an example). Approximation of the model (Eq3) to the model (Eq2) is not good with ρ=1, whereas the mean function of the model (Eq2) is close to that of the model (Eq3) with ρ = 3. To evaluate goodness-of-fit, we introduce a measure called the standardized mean absolute difference (SAAD). Let

Figure 3: Estimated mean profile of a participant (idno=3) by the approximate change-point model (Eq3) and that of the corresponding change-point model (Eq2) with ρ= 1(A) and ρ = 3 (B): the mean profile of the model with ρ= 3 is standardized to the original scale divided by ρ.

 are estimators by applying the
approximate model (Eq3). SAAD is defined as
are estimators by applying the
approximate model (Eq3). SAAD is defined as
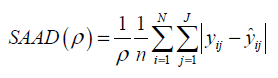
which is regarded as an average absolute difference between the observed and the predicted value standardized to the scale of original observations. Minimum of SAAD is attained at ρ = 3. With ρ = 3, the change-point is estimated as 35.43 with 95% CI: [22.32, 48.53], whereas, with ρ=1, it is estimated very differently as 25.66 with 95% CI : [13.92-37.40] (Table 1). By taking account into within-participant correlation, the width of the confidence interval of the change-point is much narrower than previously- reported one [6]. With ρ = 3, f-3 and f-6 are estimated 0.15 of 95% CI: [-0.01, 0.30] and 0.04 of 95% CI: (-0.18, 0.26) respectively (Table 2). This result indicates that about 15% intake at three days ago and 4% one at six days ago are remaining in participant's body and thus washout period seems not to be enough. Although the washout period is not necessarily enough, the estimate without the lysine effect of previous accumulation is close to that in our approach which takes account into carryover effect [6]. With ρ > 1, the estimates of xcp, f-3 and f-6 are not strongly affected by p

Table 1: Results of statistical analysis of lysine data by the approximate change-point model (Eq5) with ρ = 1, 3.

Table 2: Estimate of the change-point by the approximate change-point model (Eq4).
Simulation
We present here the results of a simulation study. The objective of the simulation study is to evaluate bias and coverage probability of the estimators for the changepoint in the presence of carry-over effect. Same as the situation in the article [6], sample size was set at n = 7 and the order of dosage of lysine was determined by a Latin square. Based on the data [6], we generated yij from the model

Parameters are set as xcp=34.5, m=0.2, f1=0.15, V(bi)=exp{(0.7)} and V(εij) = exp(0.5). One thousand datasets were generated and the model [6] was fitted to them after multiplying a constant ρ=1, 2, ..., 10. For the comparison, a model without the carry-over effect term f1wij(1) was also applied. Empirical biases and coverage probabilities for f1=0.15 with various ρs are summarized (Table 3). Biases in the estimate of the change-point by the model with the carry-over effect are negligible with ρ > 3. The carry-over effect also can be estimated with considerable biases. For both parameters, coverage probabilities are very close to the nominal level if an appropriate ρ is employed. On the other hand, the model without the carry-over effect provides the biases estimate for the change-point and the coverage probabilities are less than the nominal level. We conducted simulation experiments with the other set of parameters and obtained similar results to the above setting. These results indicate that in studies to determine the amino acid requirement, the estimation without adjusting for the carry-over effect may lead downwardly biased estimate of the change-point.

Table 3: Empirical mean and coverage of the estimator by the approximate change-point model (Eq4) in the case of the true f1 = 0.15.
Extension
The slope of the model (Eq2) after the change-point is set at 0 since it seems to be natural for determining amino acid requirement than allowing any slope parameters from biological point of view. It is useful to consider a model with arbitrary slope parameter after the change-point to evaluate the assumption of zero slope after the changepoint in the determination of amino acid requirement. Such models are often investigated for other issues in nutrition research [13,14]. Consider a model, With a similar approximate model, one can estimate unknown parameters using standard software for the nonlinear mixed effect model. With ρ = 3, the slope parameter m2 was estimated -0.0007 (95% CI: [-0.041, 0.040], P=0.96) indicating that the slope is flat after the changepoint. The estimate of the change-point was not different from the one using the model (Eq2).
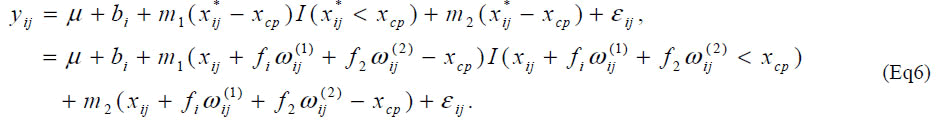
As another extension, one may consider the change-point
is participant-specific. Let the participant-specific change point denoted by xcp,i and the following structural model 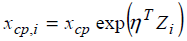 is considered, where Zi is a covariate
vector for the ith participant. The unknown parameter
h can be estimated by the method we proposed. Let Zi(1) and Zi(2) be BMI minus 1850 and RMI (resting metabolic
rate, kcal/day) of the ith participant in the data of Zello et
al.[6]. We apply the model,
is considered, where Zi is a covariate
vector for the ith participant. The unknown parameter
h can be estimated by the method we proposed. Let Zi(1) and Zi(2) be BMI minus 1850 and RMI (resting metabolic
rate, kcal/day) of the ith participant in the data of Zello et
al.[6]. We apply the model,

The parameters η1 and η2 were estimated 0.02 (95% CI: [-0.086, 0.135]) and -0.001 (95% CI: [-0.0002, 0.0016]) respectively and neither was statistically significant. The study was not designed to examine the effect of covariates on the change-point and the ranges of BMI and RMI were very narrow. It might cause non-significance of BMI and RMI.
Discussion
In this manuscript, we introduced a change-point model adjusting for carry-over effects due to repeated measure ments in determining amino acid requirement based on the IAAO technique. A simple method for parameter estimation is proposed based on approximating the discontinuous mean function with a smooth one. Our method can be easily conducted with a standard statistical software package such as R software. R is a free software developed by the R Foundation for Statistical Computing (http://www.r-project.org/). A program code in R is provided for our proposed method (Appendix I). Some researches considered to estimate the change-point from repeated measurements with alternative approximation [15,16]. Although they did not account for the carry-over effect, their approximations are also applicable to our models. Through the simulation study, we found that estimation based on approximation works well in the presence of the carry-over effect with small sample size arising in studies for amino acid requirement. Furthermore we found that estimate of the change-point with adjusting for the carry-over effect may be less biased when the order of the dosage of the target amino acid is determined by a Latin square. Thus here we recommend applying our proposed method in estimating the amino acid requirement based on the IAAO technique.
References
- Zello GA, Wykes LJ, Ball RO, et al. Recent advances in methods of assessing dietary amino acid requirements for adult humans. J Nutr 1995, 125; 2907-15.
- Roberts SA, Thorpe JM, Ball RO, et al. Tyrosine requirement of healthy men receiving a fixed phenylalanine intake determined by using indicator amino acid oxidation. Am J Clin Nutr 2001, 73; 276-282.
- Kurpad R, Regan M, Vasudevan J, et al. Threonine requirements of healthy Indian men, measured by a 24-h indicator amino acid oxidation and balance technique. Am J Clin Nutr 2007, 76; 789-797.
- Pencharz PB, Ball RO. Different approaches to define individual amino acid requirements. Annu Rev Nutr 2003, 23; 101-116.
- WHO/FAO/UNU Expert Consultation. Protein and amino acid requirements in human nutrition. World Health Organ Tech Rep Ser 2007; 935; 1–265.
- Zello GA, Pencharz PB, Ball RO. Dietary lysine requirement of young adult males determined by oxidation of L-[1-13C]phenylalanine. Am J Physiol 1993, 264; E677-85.
- Senn S, D'Angelo G, Potvin D. Carry-over in crossover trials in bioequivalence: theoretical concerns and empirical evidence. PharmStat 2004, 3; 133-142.
- Grieve A, Senn S. Estimating treatment effects in clinical crossover trials. J Biopharm Stat 1998, 3:191-233.
- D'Angelo G, Potvin D Turgeon J. Crossover effects in bioequivalence studies. J Biopharm Stat 1998, 11; 35-43.
- Seber GAF, Lee AJ. Linear regression analysis second edition. New Jersey: John Wiley and Sons Inc 2003.
- Hall CB, Ying J, Kuo L Lipton RB. Bayesian and profile likelihood change point methods for modeling cognitive function over time. Comp Stat Data Analysis 2003, 42; 91-109.
- Hayamizu K, Yamashita N, Hattori S, et al. A changepoint regression approach for efficacy evaluation of dietary supplement. J Clin Biochem and Nutr 2009, 44; 285-290.
- Davidian M, Giltinan D. Noninear models for repeated measurement data: An overview and update. J Agric Biol Envir Stat 2003, 8; 387-419.
- Kriengsinyos W, Wykes LJ, Ball RO, et al. Oral and intravenous tracer protocols of the indicator amino acid oxidation method provide the same estimate of the lysine requirement in healthy men. J Nutr 2002, 132; 2251-7.
- Slate EH, Turnbull BW. Statistical models for longitudinal biomarkers of disease onset. Stat Med 2000, 19; 617-637.
- Mei Y, Wang L, Holte SE. A comparison of methods for determining HIV viral set point. Stat Med 2008, 27; 121-139
Appendix I: R code to fit the approximate change-point model (Eq3)
#---including R package for non-linear mixed effect modellibrary( nlme)
#--input dataset---
setwd("E:\\")
data<-read.csv("E:\\data_zello2.csv",header=T)
==========================================
#---multipling constant to improve approximation---
rho<-1
data$fe_rho<-data$fe*rho
#---transforming data into repeated measurement format---- data2<-groupedData(fe~lys|id,data=as.data.frame(data))
#---Fitting approximate change-point mixed model----
result1<- nlme(fe_rho~log(1+exp(m*(lys+f1*prelys1+f2*prelys2- a)))+b+eb,
fixed=c(f1~1,f2~1,a~1,b~1,m~1),
random=eb~1,
data=data2,
start=c (f1=0.1,f2=0.1,a=30,b=3,m=-0.3),
method="REML")
summary (result1)