- Biomedical Research (2015) Volume 26, Issue 3
Detection of rapid eye movement behaviour disorder using short time frequency analysis of PSD approach applied on EEG signal (ROC-LOC).
Mohd Maroof Siddiqui1, Geetika Srivastava2, Syed Hasan Saeed31Department of Electronics and Communication, Amity University, Lucknow, 226028, India
2Department of Electronics and Communication, Amity University, Lucknow 226028, India
3Department of Electronics and Communication, Integral University, Lucknow, 226026, India
- Corresponding Author:
- Mohd Maroof Siddiqui
Department of Electronics and Communication
Amity University, Lucknow- 226028, India
Email: maroofsiddiqui@yahoo.com
Accepted Date: April 28, 2015
Abstract
Sleep disorder, is a medicinal disorder of the snooze patterns of a person or living thing. Some sleep disorders are serious adequate to obstruct with normal substantial, mental and emotional performance. In this research article, attribute and waveform of EEG Signals of human being are analyzed. The aim of this research is to draw the result in the form of signal spectrum analysis of the changes in the domain of different stages of sleep. The observations obtained on the EEG patterns can be analyzed for its utility in the diagnosis of sleep disorders like anxiety and depression. These disorders are reflected as the changes in the electrical activities and chemical activities in the brain that can be observed by capturing the brain signals and the images. In this paper Short Time frequency analysis of Power Spectrum Density (STFAPSD) approach applied on Electroencephalogram (EEG) Signals for Diagnosis of Rapid Eye Movement Behavior Disorder (RBD). Obtained results by this method are found and suitable for the differentiation normal people and RBD patient
Keywords
EEG Signals, Diagnosis Approach for RBD, Algorithm for Detection of RBD, Analysis of EEG Signal
Introduction
Sleep disorder are rapidly growing disease in developed countries excessive work pressure and changing life style has led to various diseases like anxiety sleep disorder, insomnia etc one know and popular method for detecting brain activity is through EEG signal Recording which Directly reflect brain electrical activity an EEG test is done in asleep because several times, unusual brain activity does not show up when the test is performed while being awake [1].While sleeping brainwave patterns change and shows more atypical electrical responses. A standard sleep EEG test is performed in a hospital, using a regular EEG machine, where sedative is often administered to help the subject sleep. The test can be completed within a couple of hours
The recording of the electrical activity of the brain from the scalp is termed as the electroencephalogram (EEG). Although studies were being carried out on animals as early as 1870, Hans Berger made the first recordings in 1929 [2].
The following image (fig 1) depicts the waveforms thought to reflect the activity of the cortex, which is the surface of the brain. This activity is subjective to the electrical activity from the brain structures lying underneath the cortex.

Figure 1: EEG traces.
The signals formed by the neurons are called action potentials. These action potentials travel from one cell to another across a gaps that are called synapses.
Neurotransmitters are special chemicals that help the signals to move across these gaps.
There are two types of neurotransmitters:
a) First type facilitates the movement of the action potential.
b) Second type ceases its movement to another nerve cell.
The brain normally works hard to keep the amount of these neurotransmitters at an equated number. EEG Signals are weak and very complex, calculated in micro volts (μV) with the chief frequencies of significance up to in the order of 30 Hertz (Hz) [3].
The brain emits electric waves continuously, even during sleep. A sample of wave measurements can be used by physicians specializing in sleep medicine as statistical tools to classify sleep patterns as normal or challenging. A disabled person’s thinking can be classified by Brain Computer Interfaces (BCIs) based on wave dimensions and essential instructions can be executed automatically. Even though such research is exciting, it entails a comprehensive knowledge of medicine, biology, statistics, physics, and computer science [4].
Electrical activity recorded through electrode sensors placed on the scalp is called the Electroencephalogram (EEG). The electricity is documented as waves that can be classified as regular or irregular. Measuring EEG signals is not an intrusive procedure; is painless and has been in vogue since several decades.
Various states or activity levels can be indicated by diverse forms of normal waves. Medical problems can be indicated by abnormal waves. Diagnosis of sleep disorders and production of BCIs to aid disabled individuals with daily living tasks are the two important applications of EEG wave classification.
Medical background Sleep takes up roughly one-third of a person’s life; hence it is vital for proper wellbeing and health. Nonetheless, sleep problems plague one-third Americans. For example, every fifth American adult has some degree of sleep apnea, characterized by suspension in breathing during sleep of 10 seconds or longer. Sleep apnea cannot be self diagnosed by the patient. Recording patients’ sleep patterns is necessary for diagnosis of sleep disorders, by physicians. A typical sleep recording has several channels of EEG waves coming from the electrodes located on the subject’s head. The classification of recordings of sleep stages continuously over time is termed as sleep staging. It follows pattern recognition algorithms. This procedure is performed by a sleep stager. The stages contain rapid eye movement (REM) sleep, four levels of non-REM snooze, and living being awake [5].
The identification and treatment of sleep disorders can be performed effectively through proper sleep staging. The learning of brain task is also strongly related to it. Patients’ brain activities can be continuously monitored in intensive care units by EEG wave classification. For infants at risk of development impairments, sleep staging is used to assess brain maturity. EEG wave classification techniques, originally developed for sleep staging can be adapted to many other applications as per requirement. Wave classification should be accurate for EEG-based applications to be practically viable. Pattern recognition is directly proportional to accuracy of wave measurements [6]. Since diverse sleep disorders have different sleep stage patterns, precise sleep stage cataloging allows specialists of such disorders to identify problems in a superior and quicker manner.
Such experts spend a number of years for singular training in recognizing sleep patterns prior to obtaining certification in sleep medicine. Expediting sleep disorder diagnoses also makes the procedure more economical to combat rising costs, which have surged in recent years.
EEG signals
The electroencephalogram (EEG) is a recording of the electrical activity of the brain from the scalp.The recorded waveforms reflect the cortical electrical activity.
Signal intensity: EEG activity is quite small, measured in microvolts.
Signal frequency The main frequencies of the human EEG waves are:
Delta Delta has a frequency of 3 Hz or below. It is inclined to be the maximum in amplitude and the slowest waves. It is characteristically the established measure in infants up to one year and in stages 3 and 4 of snooze. It can occur focally with sub cortical lesions and in broad allocation with disperse lesions, metabolic encephalopathy hydrocephalus or deep midline lesions. It is habitually the most prominent frontally in adults (e.g. FIRDA - Frontal Intermittent Rhythmic Delta) and posteriorly in kids e.g. OIRDA - Occipital Intermittent Rhythmic Delta) [7].
Theta Theta has a frequency of 3.5 to 7.5 Hz and is classified as "slow" activity. It is perfectly standard in children up to 13 years and in sleep but nonstandard in waking adults. It can be seen as a sign of central sub-cortical lacerations; it can also be seen in generalized distribution of diffusion disorders such as metabolic encephalopathy or some instances of hydrocephalus.
Alpha Alpha has a frequency between 7.5 and 13 Hz. Alpha is prominently shown in the posterior regions of the head on each side, and is higher in amplitude on the principal hemisphere. It appears upon closing the eyes and relaxing, and disappears when the eyes are opened or analytical operations are performed. It is the major rhythm seen in normal relaxed adults. It is present throughout most of the life particularly after the thirteenth year.
Beta
Beta activity is "fast" activity. It has a frequency of 14 Hz. It is symmetrically distributed on either side and is highly apparent frontally. Sedative-hypnotic drugs, especially, benzodiazepines and barbiturates highlight it. Areas of cortical damage may display it in curtailed magnitudes or even in entire absence. It is generally regarded as a normal rhythm. The patients who are alert or anxious or have their eyes open show it to be the dominant rhythm.
Diagnosis approach for RBD Various methods used for taking out quantitative features from an EEG signal have always faced challenges due to the fact that the dynamics of EEG depends on mind activities of processing information originates internally as well as externally. EEG signal is a highly non still process and could be described by the basic stochastic concepts of durations 10-20s [7]. A lesson showed that the unpredictability of power of the main spectral EEG components for segments between 5 to10 s ranged up to 50-100%. Hence they concluded that in order to conclude its spectrum the signal should be analyzed as a series of fixed random processes. Such processes have average values that are constant and autocorrelation functions that depend only on time differences. Such signals include prearranged average power and hence are characterized by a power density spectrum. In practice, a single realization of the random process is measured and to calculate approximate value of the power spectrum of the process is computed [8].
Algorithm for detection of RBD:
Step 1 EEG signal is extracted.
Step 2 DC section is removed (If necessary).
Step 3 Signal is accepted through a low-pass FIR filter of cut off frequency of 25 Hz.
Step 4 Sampling Frequency (Fs) sec duration descending window are placed at the start of the signal.
Step 5. Average PSD is predictable using Welch Method for the sliding windows unconnectedly.
Step 6.Area equivalent to delta, theta, alpha and sigma bands are calculated using Trapezoidal Integration technique to calculate average power.
Step 7.Power ratios are deliberate by dividing average power of subject sleep wave frequency bands by the total normal power of the entire bands.
Steps 8.Difference in power ratios of consequent frequency bands are analyzed.
Step 9.Slide the window and Repeat Step 5 to 8 for the whole signal duration.
The accomplishment of the algorithm is written in MATLAB ®
Subject details Five volunteer subjects, were selected for this study. These were referred to as the normal group as they were recorded to have no cardiac or respiratory complications and also any sleep-related problems [9]. Another collection has sleep disorder of RBD of three subjects. The subject demographics of both groups are shown in Tables 1 and Table 2 respectively. The sleep specialist scoring of their Apnea/Hypopnea Index (AHI) is also incorporated.

Table 1: Subject Demographics for Normal Subjects (n= 5).

Table 2: Subject Demographics for Pathological Cases (n=3).
Signal details: The recording setup which was followed during data collection is explained in this section. Each subject was tested for one night for approximately 8 hours. The standard polysomnographic (NPSG) data, which included
Electrocardiogram (ECG), EEG, EOG and chin electromyogram (EMG), were recorded on the data acquisition computer. The respiratory activity of the subject was measured using a pneumotachtometer which was connected to a pressure transducer. (The signal from the transducer was sent to a signal conditioning unit which was recorded by the computer. Piezo electric abdominal and chest bands were attached to the subject to record the abdominal and chest movements. Blood oxygen saturation (SpO2) was measured using a pulse oximeter, with a finger probe. A total of eighteen (18) channels were re- corded. The NPSG data was collected on a Tele factor whose maximum sampling rate is 512 Hz.
Subsequent the 10-20 System of electrode arrangement, the electrode placement for the EEG signal was C3 and A2. Two additional EEG signals recorded from the forehead were intended for a separate study. This study concentrated on the EEG data that was obtained from the electrode placement at C3 and A2
Analysis of EEG signal The following section deals with the preparation of the data in order to examine the power spectrum of the EEG signal and the algorithm used in order to estimation the power spectral density of the data
Clip Preparation for Study of Single Events
Sleep events were clipped from the EEG signal that con tained the entire night study of each individual subject using the program written in MATLAB®. Each clip enclosed sleep stage of data for the entire duration of the event.
In order to identify power spectral changes around the sleep event terminations, EEG data consequent to these specific terminations were studied.
The following figure 3 shows signal in window duration used in found of power spectral changes around sleep event

Figure 2: EEG waveform.

Figure 3: Signal in Window duration used in investigation of power spectral changes around sleep event.
Removal of DC offset: In a majority of the EEG examinations, scalp electrodes that are used are not in direct get in touch with the tissue. An indirect contact is recognized by the electrolyte bridge that is formed by an electrode jelly that is applied among the electrode and the skin. A steady potential (DC offset voltage) is formed at this connection depending on the electrolyte composition and the condition of the skin which can be as large as the magnitude of the electrical activity recorded from the brain [10]. The DC component was removed from the clipped signal by removing the best directly line fit from the data. This is compulsory before performing FFT on the signal. This was performed by MATLAB® function detrend.
The DC counteract free EEG signal was then filtered using an FIR (Finite Impulse Response Filter) low pass filter with a cut off frequency at 25 Hz. An FIR filter of order 200 was planned using a Hanning window. The output of the filter was then inverted and passed through the filter again in order to remove phase band produced by the filter [11]. This was implemented using the MATLAB ® function filtfilt in following fig 5

Figure 4: EEG clip data having DC offset (a) and having DC offset removed (b) Removal of high frequency components using a low pass FIR filter.

Figure 5: EEG signal for REM sleeps stage before (solid blue) and after filtering (green).

Figure 6: Power spectral density estimation curve of a 10s signal epoch, showing the area under the curve consequent to average power of delta, theta, alpha and sigma bands.
Calculation of the Power spectral density (PSD) The clipped data was arranged for analysis as described in Section B. The EEG data in the Fs sec window are analyzed. The power spectral density estimate was calculated using the Welch Method of averaged power using a 128 bin Hamming window.
The resolution of the transformation into the frequency domain was chosen to be 0.015 Hz .This was performed by creating a Welch object in MATLAB® by using the function band. Welch and applying it in the utility psd written in MATLAB®. This outcome in a regular power spectral density curvature (μV2 /Hz) that lies over the frequencies ± π.
Calculation of N point FFT for Power Spectrum Estimation Suppose that the signal representation in the frequency domain is X(ω) and is periodic with a period 2π, only samples in the fundamental frequency range are necessary to compute. Considering the frequency domain is sampled at N equidistant samples from 0 to fs, and then the interval between two successive samples is δf.
This is written mathematically as:
δ=f*N/fs…………………………… 1
N=8192 spectral samples, fs=512 Hz
Assuming δf = 16 sample per Hz change.
We consider N=8192 (next power of 2)
The estimated power spectrum using Welch method is thus obtained from Eq.1
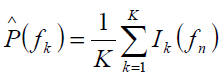
At frequencies fn = n/N where n= 0,1,...,N-1…………….. ………. …………………… 2
Calculation of area under the power spectral density estimate curve
Consequent to the sleep rhythms the average power of the sleep waves namely, delta (1-4 Hz), theta (4-8 Hz), sigma (8-13 Hz) and alpha (13-30 Hz) were considered by finding the area under the spectral curve consequent to the frequency bands.
To calculate points in the PSD curve consequent to Delta
band (1-4 Hz) Eq…… 2):
n consequent to 1 Hz = 1*δf = 16th sample
n consequent to 4 Hz =64th sample
Therefore average delta power (μV2) is the area under the
PSD curve consequent to points 16-64th.
Similarly to calculate Theta band (4-8 Hz)
n consequent to 4 Hz = 64th sample
n consequent to 8 Hz = 128th sample
Therefore average theta power (μV2) is the area under the
PSD curve consequent to points 64 to128thsample.
Similarly to calculate Alpha band (8-13 Hz)
n consequent to 8 Hz = 128th
n consequent to 13 Hz = 208th
Therefore average alpha power (μV2) is the area under the PSD curve consequent to points 128 to 208th sample.
Similarly to calculate Sigma band (13-30 Hz)
n consequent to 12 Hz = 208th
n consequent to 16 Hz = 480th
Therefore, average sigma power (μV2) is the area under the PSD curve consequent to points 208-480thsamples. The area was determined by using the Trapezoidal Integration technique which works on the standard of splitting the area under a curve into trapezoids such that their summation gives the approximate value of the fundamental. This was performed by MATLAB® function trapz.
The values of power obtained for each frequency band was normalized by the average power of the signal, in the frequency range considered, to obtain power ratios.
Normalized power of Alpha band =
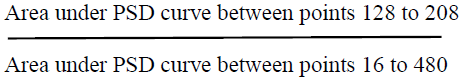
Identifying power spectral changes in EEG data of entire night duration:
From the preliminary study, power ratios for the respective sleep waves were calculated for Fs duration window. PSD calculate using Welch method was considered for all windows separately from which standard power consequent to individual frequency bands of Delta, Theta, Alpha and Sigma were calculated by verdict the area under the PSD estimated curve consequent to these bands. These values were normalized by the regular power of the signal in the Fs sec window within the occurrence range considered.
Result and Conclusion
Normalized power (Pnorm) of normal cases having no symptoms of sleep is analyzed and compared with pathological cases during S0 stage. Normalized power indicates the percentage of a particular EEG activity out of complete power. It is found that it is a better indication of measurements of detection of features instead of taking average power of particular EEG activity. For delta activity normalized power for normal cases is found in range of 0.54 to 0.68 same calculation for cases under RBD disorder is found to be 0.45 and 0.49 i.e. normalized power for delta activity during S0 stage for RBD disorder is quite low in comparison to normal cases(see table 3).

Figure 3: Comparison between normal and pathological cases for delta wave_ S0 Stage.
Similar observations are also found for Pnorm for theta activity for S0 stage. It is found that Pnorm for normal cases is low near about 0.21 to 0.23 while for RBD cases it is in the range of 0.34 to 0.36 i.e. higher in the pathological cases(see table 4).

Figure 4: Comparison between normal and pathological cases for theta wave_So Stage.

Figure 5: Comparison between normal and pathological cases for all wave_ REM Stage
However average power cannot help in drawing such conclusion using delta and theta activity. The observation related to Pnorm during alpha and beta activity do not show any distinguishing values to recognize the detection features related to normal or RBD disorder.
Similar to above discussion we also considered 2nd case of analysis related to REM stage. Normalized power (Pnorm) of normal cases having no symptoms of sleep is analyzed and compared with pathological cases during S0 stage. Normalized power indicates the percentage of a particular EEG activity out of complete power.
We considered about 3 RBD disorder cases and 5 normal cases. In RBD case delta related Pnorm. is found to be in range of 0.55 to 0.6.While normal case indicate there Pnorm in most of the case less than 0.55 in 3 out of 5 cases where as in 2 case Pnorm for delta activity is but it above than 0.6.
Most significant result is found in beta activity in RBD patients. Pnorm for this case is in a consistent range of 0.004 while in normal cases this value is varying and 4 out of 5 cases it is above than 0.05 i.e. relatively higher.
Another observation is that in RBD cases the result for all three patients are coming in very close range.
For delta activity Pnorm is 0.6.
For theta activity Pnorm is 0.30.
For alpha activity Pnorm is 0.09.
For beta activity Pnorm is 0.004.
Hence in summary the final conclusion are drawn as during S0 stage delta Pnormalized is found higher in normal cases while theta Pnormalized is lower. No significant detection measures can be drawn from alpha and beta activity.
Normalized power is helpful in detecting the RBD disorder but average power cannot help in getting desirable results.
During REM stages delta Pnormalized is found lower (<0.5, 3 out of 5) in normal cases while beta Pnormalized is lower near about 0.004.
Future prospects We learned about various sleep disorders (sleep apnea, depression, and restless leg syndrome), sleep-alteringsubstances (Alcohol, tobacco) and sleep-altering-conditions (Obesity). For the sleep disorders, we examined RBD symptoms, diagnosis and treatment; we looked at which sleep stages they affected and their effects.
However in order to classify specific detection of RBD measures it would be necessary to recognize the reasons for the false RBD detections. The opportunity of observing changes in sleep movement frequency band (1 to 25 Hz) has been studied across sleep stages specially on ROC and LOC channels .Both subjects(normal and RBD) showed a significant difference in normalized power. This can be absolute to all the channels in the prospect and if found important.
We can also consider the effect of age and gender for getting more exact results of disorder detection on the basis of state of patient. These studies can further be applied to EEG activities contaminated by noise and interference to know about robustness of our research methodology against real time situations. However along with PSD based calculation we can use automatic decisions by thresh holding the various conditions indicated by values of normalized power, through fuzzy logic, neural network etc.
Future work includes looking into diagnosis of various other neurological diseases using the ECG and other biomedical signals. Using our current methodology, we could look into new spectral analysis methods in our procedure like wavelet, AR model etc.
References
- Krajca V, Petranek S, Paul K , Matousek M, MohylovaJ, and Lhotska L, “Automatic Detection of Sleep Stages in Neonatal EEG Using the Structural Time Profiles”, Proceedings of the 2005 IEEE Engineering in Medicine and Biology 27th Annual Conference Shanghai, China, September 1-4, 2005
- Acharya RU, Faust O, Kannathal N, Chua T, Laxminarayan S, “Non-linear analysis of EEG signals at various sleep stages” Elsevier, Computer Methods and Programs in Biomedicine 2005; 80: 37-45.
- Liu D, Pang Z, Lloyd SR, “Neural Network Method for Detection of Obstructive Sleep Apnea and Narcolepsy Based on Pupil Size and EEG”, IEEE Transactions on Neural Networks, Vol. 19, No. 2, (February 2008), pp. 308-318, ISSN 1045-9227.
- Basar E, Bullock TH, “Induced Rhythms in the Brain”, Boston, 1992.
- Iasemidis LD, “Epileptic seizure prediction and control”, IEEE Trans.Biomed. Engng., 50, 2003, 549–558.
- Tzallas AT, Tsipouras MG, and Fotiadis DI, “Epileptic Seizure Detection in EEGs Using Time–Frequency Analysis” IEEE transactions on information technology in biomedicine, vol. 13, no. 5, September 2009.
- Khandoker AH, Palaniswami M, &Karmakar CK, “Automated scoring of obstructive sleep apnea and hypopnea events using short-term electrocardiogram recordings”IEEE Transactions On Information Technology In Biomedicine, Vol. 13, No.6, ( November 2009), pp. 1057-1067, ISSN 1089-7771.
- Malinowska U, Durka PJ, Blinowska KJ, SzelenbergerW. &Wakarow A, “ Micro and Macrostructure of Sleep EEG”, IEEE Engineering Medicine and Biology Magazine, Vol. 25, No. 4, August 2006, pp. 26-31, ISSN 0739-5175.
- http://physionet.org/cgi-bin/atm/ATM
- Rangayyan RM, Biomedical Signal Analysis: A Case- Study Approach, IEEE Press, (2002). ISBN 0-471-20811-6, USA
- Khandoker AH, Gubbi J, &Palaniswami M, “Support vector machines for automated recognition of obstructive sleep apnea syndrome from ECG recordings”IEEE Transactions On Information Technology In Biomedicine, Vol. 13, No. 1, (January 2009), pp. 37- 48, ISSN 1089-7771