Research Article - Biomedical Research (2017) Volume 28, Issue 2
Contourlet transform based efficient shape extraction technique for forensic odontology
Jaffino G1*, Banumathi A1, Ulaganathan G2, Vijayakumari B31Department of Electronics and Communication and Engineering, Thiagarajar College of Engineering, Madurai, Tamil Nadu, India
2Best Dental Science College, Madurai, Tamil Nadu, India
3Kamaraj College of Engineering and Technolgy, Virudhunagar, Tamil Nadu, India
- *Corresponding Author:
- Jaffino G
Department of Electronics and Communication and Engineering
Thiagarajar College of Engineering, India
Accepted on June 8, 2016
Abstract
Owing to the evaluation of information technology and an urge to investigate more cases by forensic experts, it is necessary to automate the victim identification system. For designing an automated dental identification system, dental shape extraction is a prime process. This work explains the contour based shape extraction approach applied for both ante mortem and post mortem dental images using Contourlet Transform (CT). For individual identification, contour information has been proven as a useful measure. In automatic dental identification system, contour extraction is a challenging one and the results obtained proved that contourlet transform based shape extraction techniques give a better shape extraction compared to existing fast connected component approach. In order to extract the more accurate contour, double filter bank is used in Contourlet transform. The Euclidean distance based matching was performed to compare both ante mortem and post mortem dental images. It is observed that 98% of similarity can be obtained by using contourlet transform.
Keywords
Dental radiographs, Biometrics, Forensic odontology, Laplacian pyramid, Directional filter bank.
Introduction
Biometric means life measurement but this term is usually used for unique characteristics to identify an individual. Biometrics recognition can be used to identify the individual based on physiological or behavioural characteristics of a person either in a fully automated or semi-automated manner. Forensic odontology or Forensic dentistry is a branch of forensic science. In this the identification deals with a treatment of any dental evidence system. Forensic dentistry is the application of various sciences to those criminal and civil laws that are enforced by police agencies in a criminal justice system. David Senn et al. [1] explained that identification of a person from dental records by a qualified forensic dentist has been established and accepted by courts to prove the identity of an individual. In some critical situations, if the body is completely decomposed then all the other biometric information is unavailable to identify the individual. Dental identification is more often accomplished by comparing post mortem (PM) dental radiographs of an unidentified person with ante mortem (AM) radiograph of known individuals. In person identification with dental images teeth are hardest and robust tissue in our human body and it can withstand decomposition level of temperature up to 12000ºC. As per survey, Petjua et al. [2], 2004 Tsunami and 2005 Thailand Tsunami attack has proved that most of the victim identifications were done by using dental charts i.e.) out of 951 victims identification 879 persons are identified based on dental charts and remaining 42 persons are identified with other methods. The dental radiographs are normally captured in four forms such as Bitewing, Perapical, occlusal and panoramic images. Among these, both periapical and bitewing gives better results for individual identification.
This work concentrates only bitewing radiographs that can be taken from two different views and it is shown in Figure1. Generally, the bitewing images are considered for 8 teeth and 4 teeth at the maximum of each jaw. The left side captured image pattern is ‘PPM’ and the right side captured image pattern is ‘MMP’. In forensic dentistry, AM and PM comparison is done manually, which may take long time and it does not yield more accurate results in all cases.

Figure 1: Dental Bitewing radiographs. (A) Left side view (B) Right side view.
Related work
Anil Jain [3] initially projected the semi-automatic contour extraction technique. The problem is fuzzy tooth contours caused by poor image quality. Omaima Nomir et al. [4] proposed edge and morphological operation based contour extraction technique but in this paper they failed to explain occluded and obscured quality images. Hong Chen et al. [5] explained the contour extraction technique from the dental work and they are not explained evidently feeble quality of images. Extracting dental work alone may not be sufficient for better matching. In addition to the tooth contour, dental work can also be considered. The poor quality image tooth contours are indiscernible. Gradient based contour extraction technique has been proposed by Hong Chen et al. [6]. The main drawback of this method is not able to discriminate edges in multiple objects. But in this technique, the result shows the edges overlie on boundary of the object. The basic idea of active contour model is to start with a curve around the object is to be detected, and the curve moves towards its interior normal and stops on the true boundary of the objects based on an energy-minimising model. Many methods have been introduced to improve the active contour model but Osher et al. [7] has proposed the most important one. Level set method is based on active contour model and particularly designed to use deformable curve for approximating the boundary of an object. Matching is improved by fusion technique as explained by Nomir et al. [8]. Human identification using shape and appearance of tooth is also explained by Nomir et al. [9]. Vijayakumari et al. [10] explained the concept of Fast connected component based contour shape extraction and then matching by Mahalanobis distance. Fast connected component labelling is used to connect the edges but the edges may shows discontinuity in the outer contour and then matching was performed. Hierarchical distance [11] based matching of dental records proves to be an efficient one in terms of retrieval time. Contour feature extraction based on classification and numbering approach is used to classify the teeth in to molars or premolars are explained by Mohammed Mahoor [12]. Numbering of teeth is based on universal numbering system and Bayesian classifier has been used to classify the teeth. Lin [13] explained the concept of classification and numbering based contour extraction. Based on universal numbering system the numbers are assigned to each individual tooth and then contours are extracted from the tooth. The concept, that non-separable contourlet filter bank gives the multi resolution and multi direction smooth contours have been proved by Minh [14]. In this paper, they proved that contourlet transform gives better multi resolution and multi direction compared to wavelet filters. In order to improve the multi directional information from the filter bank Truong Nguyen [15] proposed a uniform and non-uniform directional filter bank. The nonuniform directional filter bank gives high magnitude coefficients in the sub bands of the filter bank that corresponds to extract more geometrical features like edges and textures of an image and it has better perceptual quality to improve the edges. Energy features based contourlet transform is applied for palm print recognition and it was explained by Shanmugapriya et al. [16]. In order to get smooth contour, a sparse expansion of image has to be obtained from the contourlet transform. A literature survey report states that many of the contour extraction approaches for dental images are existing one but in the frequency domain contour extraction has not been introduced. This research work will explain the contourlet transform based contour extraction techniques. The paper work is organised as follows. The pipe line of proposed method is shown in Figure 2. The second section explains the shape extraction of dental images. The third section, explains the shape matching of contourlet transform and results and discussion is explained in the fourth section.

Figure 2: Pipe line of proposed method.
Pre processing
Pre-processing is more important to remove unwanted information presented in the image. Median filtering is used to smooth the image and it preserves edges present in an image while reducing noise [17]. It can preserve discontinuities in an image and can smooth a few pixels whose values differ significantly from their surroundings without affecting the other pixels. Here the median method was performed by 3 × 3 windowing operator over the image. It replaces the value of component with the median of neighbourhood pixels. To calculate the median by sorting the whole component values from the neighbourhood into numerical sort and then replace the component with the middle component worth. If the neighbourhood below condition constitutes a good pixel worth, the common of two middle component values is the median.
Image partitioning
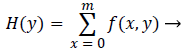
The separation between each tooth can be calculated by using horizontal and vertical integral intensity projections. Horizontal integral projection is used to separate upper and lower jaws and vertical integral projection is used to separate each individual tooth [3]. Let f (x, y) be the image of size m × n and summing all intensities in horizontal direction gives the gap valley; whereas summing all intensities in vertical direction will separate each individual tooth. Mathematically, the horizontal integral projection is,
 (1)
(1)
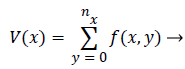
Since the teeth usually have a higher gray level intensity than the jaws, due to their higher intensity, the gap between upper and lower teeth will form a y-axis projection histogram which is called gap valley. After finding the gap valley, the vertical line will be drawn to form a vertical integral intensity. The vertical projections of {V (x0), V (x1).....V (xn)} will form a graph of integral intensity and mathematically it can be expressed as,
 (2)
(2)
Where, nx is the intersecting point of each column and the horizontal separating line of upper and lower jaws.
Shape extraction
In this paper, the shape extraction is done by using contourlet transform. This work proposed double filter bank structure, named pyramidal directional filter bank by combining laplacian pyramid with directional filter bank is used to extract contour features. The contourlet transform offers a flexible multi resolution and directional decomposition for images, as it allows for a different number of directions at each scale. Pseudo code for laplacian pyramid is as follows.
G{0}=Original image
{
Choose w{K}
G{K}=REDUCE (G{K-1}
G{k}* w{K}
If G{K} ≥ G{N} (N-Maximum reduction of the original image)
G{N} ≥ Max reduction (Gaussian pyramid output)
Stop
G{N}=input of laplacian pyramid
G’{K}=EXPAND (G{K+1})
L{K}=G{K}-G’{K}
}
Gaussian pyramid
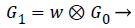
The first step of laplacian pyramid is to low-pass filter the original image of G, to obtain G0. Then low pass filtering G0 to obtain G1 and so on. Filtering is performed by convolving a weighting function with low-pass filtered image. Suppose the image is initially represented by an array G which contains C number of rows and R number of columns. Each pixel is represented by a light intensity at a corresponding image point between 0 and k-1. This image becomes the bottom or zero level Gaussian pyramid [18]. Pyramid level 1 contains the image G0, which is reduced or low-pass filtered image of G. Each value within level 1 is computed as a weighted average of values in level 0 within a 5-by-5 window. The weighting function is not unique for all levels. Each level of process can be generated by a function REDUCE written as,
G {K} =REDUCE (G {K-1}) → (3)
Which means that levels are represented as 0<l<N and the pixel values i, j, 0<I<Cl and 0<j<Rl
 (4)
(4)
Where, N is the number of levels in the pyramid, Cl and Rl are the dimensions of lth level and w is the weighting factor.
Generation of weighting factor
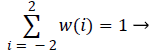
Each level for the Gaussian pyramid can be taken as 5-by-5 window, since the same 5-by-5 pattern of weights w is used to generate each pyramid array from its predecessor. The weighting factor w is separable and symmetric.
w (i, j) = w (i) w (j) → (5)
w (i) = w (-i) for i = 0,1 ,2 → (6)
For one dimensional signal, length 5 and the function is normalised as,
 (7)
(7)
The convolution weights are symmetric, separable, normalised and have equal contribution i.e.) all nodes at a given level contribute the same total weight (=1/4) to the nodes at the next higher level. Convolution weights are given by,
w (2) = w (-2) = 1/4-a/2
w (1) = w (-1) = 1/4 → (8)
w (0) = a
Here, parameter is chosen to be 0.4 because it is used to create a Gaussian- like weight function. Iterative pyramid generation is equivalent to convolving the image with equivalent weighting function.
 (9)
(9)
For 2-D, first convolution takes place across rows and then columns. Up to the maximum reduction of image size convolution operation was performed. Gaussian pyramid is obtained from the final reduction level.
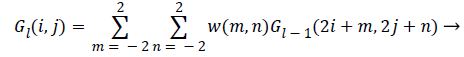
Laplacian pyramid
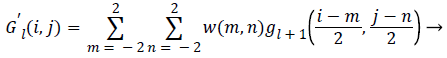
The final reduction level of Gaussian pyramid is given as input to the laplacian pyramid and then operation is performed for each level. Laplacian Pyramid (LP) is the prediction error for the pixel values between original image and the construction of laplacian pyramid for a single level is shown in Figure 3. The EXPAND image for each level is G’0, G’1 and so on. The equation is given as,

Figure 3: Construction of laplacian pyramid for single level.
G’ {K} = EXPAND (G {K+1}) → (10)
Which means that levels are represented as 0<l<N and the pixel values i, j, l 0<I<Cl and 0<j<Rl
 (11)
(11)
The different level of laplacian pyramid can be represented as,
L {K} = G’ {K} → (12)
Where L {K} the prediction error and the difference for each level are the laplacian pyramid values.
Directional filter bank
The high frequency content like smooth contours and directional edges were captured by directional filter bank (DFB). It divides a 2-D spectrum in two directions, horizontal and vertical. The DFB is implemented so that the directional information is captured by using a k-level decomposition that leads to 2k directional sub-bands with wedge shaped frequency partitioning. This aids to preserve the directional information also. The combination of LP and DFB is known as contour let filter bank. In order to avoid discontinuity edges, DFB is used. Here, 3-level decomposition leads to 8 directional sub-bands with wedge shaped frequency partitioning. Sub bands 0-3 correspond to mostly horizontal directions and 4-7 correspond to vertical directions.
Shape matching
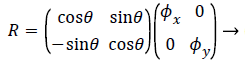
The contours extracted from the query image must be matched with the database image. Shape matching is observed with Euclidean distance measures to make obvious decision about victim identification. The post-mortem (PM) images that are captured after a long time from ante-mortem (AM) images are acquired, since the shape of the teeth varies due to teeth extraction or growth of the teeth [19]. In order to find the best contour alignment it is necessary to apply rigid transformation to both ante-mortem and post-mortem images before calculating the distance. Improving matching distance can be obtained by rigid transformation and it is of the form,
X’ = Rx + t → (13)
Where R is the transformation matrix, t is the translation vector and x’ is the transformation on x. R and t can be represented as,
 (14)
(14)
 (15)
(15)
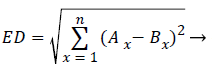
Where θ is the rotation angle, Φx, Φy are horizontal and vertical scale factors, τx and τy are horizontal and vertical translation. The distance measured for finding the similarity is of critical importance. Euclidean distance measure is like a distance obtained between points A (A1, A2, etc.) and a point B (B1, B2, etc.). The difference between both AM and PM images are calculated by using Euclidean distance (ED) and it is obtained by,
 (16)
(16)
Here Ax and Bx refers to each and every pixel in both the images. If the matching distance is zero, then it will be a better matching.
Results
In the proposed dental identification method, the real database has been collected from 45 patients from Madurai digital dental x-ray centre. It includes 90 bitewing radiographs of both left and right views. Out of that 75 radiographs are considered as anti-mortem images and 25 are post mortem images. Some of the sample input images taken for analysis are shown in Figure 4.

Figure 4: Sample radiographic images.
Discussion
This algorithm is evaluated with database of dental image which includes radiographic images. The proposed frequency domain contour based approach was developed in Matlab R 2010a and it was tested for few database images. In order to preserve edges and smoothed the median filtering operation was applied in the original image and corresponding preprocessed results are shown in Figure 5. It increases the brightness and uniform intensity can be obtained for the preprocessed result. Victim identification can be made perfect by considering each individual tooth separately rather than the whole image. Hence horizontal and vertical integral projections are used to separate each and every individual tooth. The horizontal and vertical integral intensity projection of an image is shown in Figure 6. Figure 6a shows the horizontal integral projection output and Figure 6b shows the vertical integral projection of upper maxilla teeth. The partitioned result applied for pre-processed image is shown in Figure 7.

Figure 5: Median filtered output.

Figure 6: Integral intensity projections of a) Horizontal integral projection, b) vertical integral projection of upper maxilla.

Figure 7: Partitioned radiographic images.
This work can also be implemented with each individual tooth image such as molar and pre molar radiographic tooth. This work proves that better matching will be obtained for individual tooth rather than the whole image. Some of the sample radiographic individual tooth images are shown in Figure 8. The partition of each image clearly depicts that first horizontal integral projection was obtained for each image to get the gap valley and then vertical integral projections were obtained for individual partitioning of teeth. The proposed work consists of both laplacian pyramid and directional filter bank. In the existing techniques, the contourlet transform has not yet been discussed for dental images. Even though fast connected component approach is an automatic dental identification system used in the contours obtained are not convincing. The comparative result analysis for both contourlet transform and fast connected component analysis are tabulated in Table 1.

Figure 8: Sample database images: Molar, Premolar radiograph images.

Table 1: Comparative results for CT and FCC.
In this proposed method, the result of laplacian pyramid gives discontinuities in the contour and the directional filter bank removes all the discontinuities present in the contour. For person identification while matching both post-mortem and ante mortem images, instead of matching the whole images, if a single part like either a jaw or single tooth may be compared and that leads to better results. Result of the contour for both FCC and CT was compared with the 3-D plot analysis and it is shown in Figure 9. The result of the query image contour is matched to the database contours by Euclidean distance matching. The minimum distance between query and database image is taken as best matching, because lesser the matching distance, better will be the matching. In Figure 10 Euclidean distance is considered as a distance metric. Here, the image B with matching distance of 0.41 is the genuine image and the image C with matching distance of 0.95 is an imposter image. For individual identification, instead of the whole image a single tooth image can be used for better matching. The matching of maxilla and molar mandible of query contour with database contours are shown in Figure 11 and Figure 12. In Figure 11, upper jaw of the query image was compared to the database images and it is observed that the matching of 0.04 in the B1 image is genuine image and the distance of 0.62 C1 is an imposter image. In Figure 12 the molar mandible tooth is discussed, and it is observed that the matching of 0.01 in the B2 image is genuine image and the distance of 0.31 C2 is an imposter image. The performance analysis of this algorithm is validated and compared with Fast connected component analysis. Contourlet transform uses a double filter bank structure to get the smooth contours of images. The extracted contour result gives no discontinuity than FCC.

Figure 9: 3-D Contour representation of dental images. (a), (c), (e) 3- D contour representation of FCC. (b), (d), (f) 3-D contour representation of CT.

Figure 10: Matching of query contour with database contours.

Figure 11: Matching of upper jaw query contour with database contours.

Figure 12: Matching of molar mandible query contour with database contours.
Performance evaluation
AM and PM images can be compared using similarity measures. Sum of absolute difference is one of the simplest methods and it is calculated by subtracting pixels within a square neighbourhood between the database tooth image and query tooth image followed by the aggregation of absolute differences within a square window. If both the images exactly match then the resultant will be zero. Sum of Absolute Difference (SAD) is calculated by using,
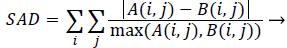 (17)
(17)
Where, A and B are two different images. And additionally another measure, Average Difference (AD) is used to find the difference between two images as,
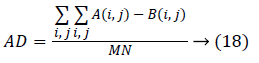
Where, M and N are the size of image. The SAD and AD between contourlet transform and FCC output is observed and it is given in Table 2. While matching it is observed that the matching performance with the single tooth yields better results than comparing as a whole image. From this Table, it is clear that both of the measures are related (i.e.) the lowest Euclidean distance of 2.25 is observed for the image tooth 7 and the SAD obtained is also least for the same image. Similarly, dent 9 has the highest values in both. Also for considering other image the lowest Euclidean distance of 4.56 is observed for the image dent 5 and the SAD obtained is also least for the same image. The tooth 4 has highest values in both.
| Sample images | Contourlet Transform | Fast Connected Component | |||
|---|---|---|---|---|---|
| PM | AM | Sum of absolute difference (SAD) | Average difference (AD) | Sum of absolute difference (SAD) | Average difference (AD) |
| Tooth 3 | 0.8648 | 45.32 | 0.8816 | 48.47 | |
| Tooth 11 | 0.9561 | 53.48 | 0.9822 | 59.31 | |
| Tooth 7 | 0.3215 | 27.41 | 0.4876 | 30.64 | |
| Tooth 5 | Dent 2 | 1.2023 | 73.46 | 1.4986 | 79.78 |
| Dent 9 | 1.4213 | 79.24 | 1.7102 | 89.21 | |
| Dent 1 | 0.635 | 66.01 | 0.7449 | 42.11 | |
| Dent 5 | 0.5212 | 31.22 | 0.6211 | 32.44 | |
| Dent 8 | 1.0254 | 71.55 | 1.1236 | 75.22 | |
| Dent 4 | Tooth 4 | 1.9988 | 80.11 | 2.0121 | 91.33 |
| Tooth 1 | 1.7988 | 75.23 | 1.5233 | 87.42 | |
Table 2. Similarity measures.
It is observed that, the Euclidean distance between the entire query and database image values are less for contourlet transform. It is also inferred from Table 3, that the Euclidean distance obtained with contourlet transform is yielding lesser values than the fast connected component analysis. Database includes 90 bitewing radiographs of both left and right views. Out of that 75 radiographs are considered as anti-mortem images, 25 are post mortem images and the identification accuracy details are tabulated in Table 4.
| Images | Contourlet Transform | Fast Connected Component | |||
|---|---|---|---|---|---|
| PM | AM | Euclidean distance (ED) | % of similarity | Euclidean distance (ED) | % of similarity |
| Tooth 5 | Tooth 3 | 3.68 | 96.32 | 5.85 | 94.15 |
| Tooth 11 | 5.96 | 94.89 | 7.04 | 92.96 | |
| Tooth 7 | 2.25 | 97.78 | 3.69 | 96.31 | |
| Dent 2 | 7.88 | 92.12 | 9.47 | 90.53 | |
| Dent 9 | 9.89 | 90.11 | 12.63 | 88.37 | |
| Dent 4 | Dent 1 | 6.13 | 93.87 | 10 | 90 |
| Dent 5 | 4.56 | 95.44 | 8.78 | 91.22 | |
| Dent 8 | 7.7 | 92.3 | 12 | 88 | |
| Tooth 4 | 10.79 | 89.21 | 17.66 | 82.34 | |
| Tooth 1 | 8.22 | 91.78 | 12.35 | 87.65 | |
Table 3. Comparative performance.
| Patients considered for analysis | Images | Successful Identification in % | |
|---|---|---|---|
| AM | PM | ||
| 45 | 75 | 25 | 98% |
Table 4. Identification accuracy details.
Conclusion
In this paper, an automated dental identification system was demonstrated and it facilitates to provide an aid for forensic law enforcement with the help of radiographic dental images. This work is mainly focused on frequency domain based contourlet transform for tooth shape extraction and Euclidean distance based matching technique to identify a person. It involves pre-processing, integral intensity projection, feature extraction by contourlet transform and finally matching is performed with Euclidean distance. This will be mainly helpful for forensic dentistry to identify the missing persons in some critical mass disasters. After analysis it is observed that, this algorithm proved to be an automatic, less complex and produces satisfied results. This work elaborates the importance of contourlet transform in dental radiographic images. The experimental results clearly show that, single tooth radiograph image yields better result than the whole images. In addition to this, the contourlet transform gives clear contour information than the previous techniques. The proposed method gives 98% of successful identification accuracy while comparing with the existing algorithm.
Acknowledgement
The authors would like to thank University Grants Commission, New Delhi, India with F.No:42-116/2013 (SR) dated 12 March 2013 for funding this project. We would also like to thank Department of ECE, Thiagarajar College of Engineering, Madurai, and Tamilnadu, India for providing all the facilities to carry out this work.
References
- David RS, Paul GS. Forensic Dentistry. CRC Press 2010.
- Petjua M, Suteerayongprasertb A, Thongpudc R, Hassirid K. Importance of dental records for victim identification following the Indian Ocean tsunami disaster in Thailand. Public Health 2007; 121: 251-257.
- Anil KJ, Hong C. Matching of dental X-ray images for human identification. J Patrn recogn 2003; 1519-1532.
- Omaima N, Mohamed AM. A System for Human Identification from X-ray Dental Radiographs. J Pattern recogn 2005; 38: 1295-1305.
- Hong C, Anil KJ. Dental bimetrics: Alignment and Matching of Dental Radiographs, IEEE Trans Pattern Anal M Intel 2005; 27: 1319-1326.
- Hong Ch, Anil KJ. Tooth Contour Extraction for Matching Dental Radiographs. IEEE Pattern Recogn 2004; 2128-2132.
- Osher S, Sethian J. Fronts propagating with curvature dependent speed: algorithms based on Hamilton Jacobi formulations. J Comp Phys 1988; 79: 12-49.
- Nomir O, Mohamed AM. Fusion of matching algorithms for human identification using dental X- ray radiographs. IEEE Trans Info Secur 2008; 3: 223-233
- Nomir O, Mohamed AM. Human Identification from dental X-ray images based on shape and appearance of the teeth. IEEE Trans Info Secur 2007; 2: 188-197.
- Vijayakumari P, Ulaganathan G, Banumathi A. An Effective shape extraction algorithm using contour information and Matching by Mahalanobis distance. J Digital Imaging 2012; 26: 1-8.
- Nomir O, Mohamed AM. Hierarchical contour matching for dental X-ray radiographs. Pattern Recogn 2008; 41: 30-138.
- Mohamed HM, Mohamed AM. Classification and Numbering of teeth in dental bitewing images. J pattern Recogn 2005; 38: 577-586.
- Lin PL, Lai YH, Huang PW. An Effective Classification and Numbering system for dental bitewing radiographs using teeth region and contour information. J pattern Recogn 2010; 43: 1380-1392.
- Do MN, Martin V. The contourlet transform: an efficient directional multiresolution image representation. IEEE Trans Image Proc 2005; 14: 2091-2106.
- Truong TN, Soontorn O. Multi resolution Direction filter banks: Theory, Design and Applications. IEEE Trans Signal Proc 2005; 53: 3895-3905.
- Shanmugapriya K, Karthiga M, Valarmathi S, Arunkumar M. Performance Evaluation of contourlet transform based Palmprint Recognition using Nearest Neighbour Classifier. Int J Emerg Technol adv Eng 2013; 3: 294-299.
- Subbuthai P, Kavithabharathi K, Muruganand S. Reduction of types of noises in dental images. Int J Comp Appl Technol Res 2013; 2: 436-442.
- Peter JB, Edward HA. The laplacian pyramid as a compact code. IEEE Transactions on Commun 1983; 31: 532-540.
- Banumathi A, Vijayakumari B, Geetha A, Shanmugavadivu N, Raju S. Performance analysis of various techniques applied in human identification using dental images. J Med syst 2007; 31: 210-218.