Research Article - Biomedical Research (2018) Volume 29, Issue 19
Computer aided diagnosis of breast cancer based on level set segmentation of masses and classification using ensemble classifiers
Asim Ali Khan* and Arora AS
Department of Electrical and Instrumentation, Sant Longowal Institute of Engineering and Technology, Longowal, India
- *Corresponding Author:
- Asim Ali Khan
Department of Electrical and Instrumentation
Sant Longowal Institute of Engineering and Technology
India
Accepted date: October 16, 2018
DOI: 10.4066/biomedicalresearch.29-18-1053
Visit for more related articles at Biomedical ResearchAbstract
Breast cancer has been ranked number one cancer in Indian females with rates occurrence of 25.8 per 1,00,000 females and death rate 12.7 among 1,00,000. Whereas in USA, the estimated new detected cases of breast cancer are 2,52,710 with 15% of all new cancer cases with estimated deaths of 40,610 women i.e. 6.8% of all cancer deaths in 2017. The mammograms can help an early detection of lesions by radiologists before it becomes incurable. But the degree of variations among the different radiologists is very high resulting in false positives and false negatives. So a great amount of research is focused on the design of computer aided diagnosis (CAD) for early detection of breast cancer from the mammograms. In quest of high accuracy, this paper aims at developing an automated computer aided diagnostic (CAD) system that detects the malignant neoplasms from the mammograms. A novel technique is used to remove the pectoral muscle in pre-processing stage in order to make the segmentation of suspicious masses from breasts easier. The active contour based level set method is used to segment the mammograms. The texture features being most implemented in mammographic analysis, the standard gray-level co-occurrence matrix (GLCM) texture descriptors by Harallick are extracted from the segmented images. Finally, ensemble classifier is used to classify the mammograms into normal and abnormal, and then abnormal ones into malignant and benign. The respective accuracies obtained are 97.46% and 82.05% respectively.
Keywords
Breast cancer, Mammography, Computer aided system, Level segmentation, Ensemble classifier, Graylevel co-occurrence matrix (GLCM) texture descriptors
Introduction
Cancer is the uncontrolled growth of the cells, some of which may spread into other tissues [1-4]. Breast cancer is a life threatening disease of unknown cause that affects women around the world. Breast cancer starts when abnormal cells grow along the duct. Lesions are categorized as masses, micro calcifications or architectural distortions. A mass is an accumulation of cells in one region that can be benign or malignant. Micro calcifications are small bright accumulation of calcified milk. These can be categorized as malignant or benign depending upon their size, shape or contour. Architectural distortion is when the normal architecture of the breast is distorted without traces of masses [5].
A low-dose X-rays are used to capture the image of breast and this image is called mammogram. Mammogram is the considered to be most viable way for detection of breast cancer before it becomes clinically tangible as compared to other imaging techniques such as magnetic resonance imaging and ultrasound imaging [6,7]. Mammograms are categorized as screening mammography and diagnostic mammography. Screening mammography is used to detect cancers early in routine periodic check-up. Diagnostic mammography is used in abnormal cases detected during screening mammography. There are two views in the Screening mammograms i.e. cranial-caudal view, (CC) and medio lateral-oblique (MLO).
In screening mammography, due to inter and intraobservational differences, there are more chances of errors in reading the mammograms. So CAD systems can be used for double reading to increase the reader accuracy of breast cancer detection. The CAD systems reduce the sensitivity of variations of mammographic screening with the expertise of the radiologists [8]. So huge amount of research is being carried out to automate the mammographic screening [9-13].
Materials and Methods
There are five major steps in the design of the proposed CAD for detection of masses in mammograms. An outline of the proposed system is shown in Figure 1 and all steps are explained in the following sections in details.

Figure 1: CAD system for detection of masses in mammograms.
Database
The database in this paper is taken from mammographic image analysis society (MIAS). This database has hidden masses so making it difficult to analyse. The database has mammograms of left and right breasts of 161 women i.e. total of 322 mammograms in digitized form [14]. An 8-bit word is used to represent each pixel. In original MIAS database each image is clipped/padded to make every image of size 1024 × 1024.
Pre-processing
The proposed algorithm provides the preprocessing steps to preserve the breast area and eliminate the noises present in the mammograms [15]. The black border area, the low intensity and high intensity labels are removed and all mammograms are made left aligned as shown in Figure 2.

Figure 2: Label removed and left aligned mammogram.
Pectoral muscle removal is an important step in pre-processing, as this area of breast has brightness level almost equal to masses which can cause segmentation error. A novel method is used in this work to remove pectoral muscles in mammograms. The pectoral muscle removal is shown in Figure 3.

Figure 3: Removal of pectoral muscle.
To remove the noise and retain the necessary frequency information, Difference of Gaussian filter is applied to obtain the final pre-processed image [16] as shown in Figure 4.

Figure 4: Difference of Gaussian (DoG) applied to mammogram.
Extraction of a region of interest
An automatic cropping algorithm is used to extract the region of interest (ROI) and the result is shown in Figure 5.

Figure 5: Region of interest (ROI) extracted images.
Segmentation
The main logic in active contour segmentation is to evolve a curve, subject to constraints from the image in order to trace objects in it. For example, it is to start with a curve around the object to be traced, the curve moves to its interior normal and stop on the boundary of the object [17]. The boundary is given by level sets of a function ϕ ( ), and the level set was method first introduced by Osher et al. [18].
Consider a curve in 2D or a surface in 3D with velocity fields, which is dependent on space, time, properties of the boundary and has an indirect dependence from simulations using the shape of the boundary. The purpose is to accurately model the evolution of the boundary under the velocities v. Let G be the speed function and the velocities be given as s=G N, where N is the normal direction. The zero level set of a function, ϕ(x)=0, define the interface for all x, not just the ones on the boundary.
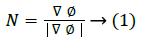
The one example of implicit representation is the signed distance function with the property |ϕ|=1, with two signs at the two sides of the boundary interface. The shortest distance from x to the boundary ϕ=0 is given by |ϕ(x)|. The ϕ needs not to be being a distance function in level set method, but the numerical approximations are inaccurate if the gradient of ϕ has large changes in the gradient. The normal vector is given by
The level set snake function is defined as the zero level set of an implicit function ϕ defined over the whole image I. This function changes with time according to the speed function F. The curve is evolved in normal direction with speed term F. The ϕ evolves in accordance with Equation 2 with the help of a partial differential equation.
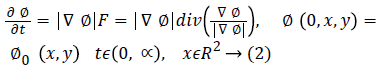
The set {(x, y)|ϕ0 (x, y)=0} defines the initial contour. The classical speed term is defined as:
F=g (|I|)(γ+k) → (3)
Where g (x) is the stopping function and the curvature k is defined as:
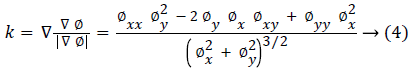
The simplified Chan-Vese energy minimization model is used in this paper and it is given as
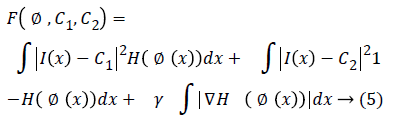
Where H is the Heaviside function the image domain Ω is separated by the contour C into regions Ω1,………., N and Ω= Ωi Ni=1.
After evolution, ϕ does not remain a signed distance function. So ϕ is reinitialized by finding a new ϕ with the same zero level set but with |ϕ|=1. The Sussman re-initialization model is used for this purpose. It is described in equation
Feature extraction
The next step is the extraction of texture features from the segmented image which is useful for further analysis of the image. Haralick [19] first introduced the use of co-occurrence probabilities using GLCM for extracting various texture features. The GLCM is a 2D histogram of gray levels for a pair of pixels, which are separated by a fixed spatial distance. A displacement vector is defined by its radius d and orientation θ to compute the GLCM of an image. The size of the matrix is determined by the number of gray-levels in the image. The relative frequency of two pixels, separated by a pixel distance (Δx, Δy), one with intensity i and the other with intensity j is represented by matrix element P (i, j|Δx, Δy). The matrix element P (i, j|d, θ) contains the second order statistical probability indices for changes between gray-levels i and j at a particular distance d and at an angle θ.
The image used in this work is 1024 × 1024, 8-bit gray-scale image and having total gray levels of 256. The quantized graylevel used here is 256. A window of size 3 × 3 is used to find the co-occurrence probabilities.
Classification of mammogram masses
An ensemble classifier consists of different classifiers in which the decisions of these are combined together by various voting methods for classification purpose. The various methods for constructing efficient and accurate ensembles of classifiers has been the topic of research in recent times. It is now well proved that results of the ensembles are better than the individual classifiers. If the classifiers are accurate and diverse, it can ensure classifiers to be more accurate than any of its constituent classifiers. There are three basic reasons for design of accurate ensemble classifiers. [20].
The statistical aspect is the foremost reason behind the accuracy of ensemble classifier. A learning method may be considered as searching a space of hypotheses to find the best one. When the hypothesis space is too large as compared to the data available, it results in statistical issues. With insufficient data, the learning method may obtain many different hypotheses in space that results in the same accuracy on the training set. The second cause is the computational problem. Most of the learning algorithms in local search get ridden in local optima. Thee neural network (NN) is an example of this problem that uses gradient descent to reduce an error function over the training dataset and decision algorithm uses a greedy splitting rule to grow the decision tree. There can be large computational involved to find best hypothesis if a large data is available. Though large data can reduce the statistical problems [21].
The last reason is representational. Any of the hypotheses cannot represent the actual function. By combining weighted sums of hypotheses drawn from space, it is feasible to expand the space of representable functions.
Results
The pre-processing steps like label removal and pectoral muscle removal have been executed successfully to extract the proper region of interest (ROIs). The mammograms after being pre-processed are cropped using the automatic cropping algorithm to extract the region of interest. Then it is segmented using active Contour based Level Set method. The results of the segmentation are shown in Figure 6.

Figure 6: Segmentation results using active contour based level set method.
Haralick thirteen texture features are extracted over the GLCM matrix. The features like energy and inverse difference moment are high in case of normal candidates as they have homogeneous texture as compared to masses. The malignant masses provide a high measure of contrast as compared to benign masses due to its high radiopaque nature. All thirteen Haralick texture features are evaluated for both normal and malignant/benign set.
Firstly, the masses are classified into normal and abnormal masses using SVM classifier with overall accuracy of 96.83% with maximum accuracy of 97.06%. As shown in the Figure 7, there are 5.6% cases of false positives that can result into unnecessary further investigations with no case of false negative.

Figure 7: Confusion matrix for classification of normal/abnormal masses using SVM.
The abnormal masses are classified further into benign and malignant cases using SVM and overall accuracy of 73.5% and with maximum accuracy obtained is 78.79%. The false positives detected are 26.8% which can result in unnecessary biopsies and with 12% missed cases of malignant cases as shown in Figure 8. Further to improve the accuracy of the detection, the ensemble classifier is used in this work.

Figure 8: Confusion matrix for of classification of benign and malignant cases using SVM.
Then the masses are classified into normal and abnormal masses using ensemble classifiers with overall accuracy of 97.46%. The abnormal masses are classified further into benign and malignant cases to rule out unnecessary biopsies in benign cases. The accuracy achieved in these cases is 82.05% with ensemble classifier.
The comparison of the classification results using three different classifiers i.e. multilayer perceptron classifier, Knearest neighbors (KNN) and support vector machine (SVM) over seven iterations are shown in Table 1. The performance of the SVM and KNN are almost at par with each other having accuracies 96.83% and 96.90% respectively.
| Iterations | 1 | 2 | 3 | 4 | 5 | 6 | 7 | Mean ± SD |
|---|---|---|---|---|---|---|---|---|
| MLP | 0.9687 | 0.9644 | 0.9248 | 0.9602 | 0.9557 | 0.9647 | 0.9688 | 0.9582 ± 0.015 |
| KNN | 0.9777 | 0.9777 | 0.9733 | 0.9559 | 0.9736 | 0.9691 | 0.9557 | 0.969 ± 0.009 |
| SVM | 0.9777 | 0.9688 | 0.9822 | 0.978 | 0.9464 | 0.9646 | 0.9603 | 0.9683 ± 0.012 |
Table 1. Classification of masses and non-masses using different classifiers.
The results of classification of masses and non-masses using different combining methods of ensemble classifiers are shown in Table 2 and it is found that the performance of Dempster Shafes, decision template and majority voting is same. The accuracy achieved with ensemble classifier is more than with any individual classifier which justifies the use of ensemble classifier for classification.
| Iterations | 1 | 2 | 3 | 4 | 5 | 6 | 7 | Mean ± SD |
|---|---|---|---|---|---|---|---|---|
| Majority voting | 0.9821 | 0.9777 | 0.9822 | 0.9692 | 0.9733 | 0.9691 | 0.9689 | 0.9746 ± 0.006 |
| Maximum | 0.9732 | 0.9599 | 0.9688 | 0.9648 | 0.9425 | 0.9602 | 0.9513 | 0.9601 ± 0.01 |
| Sum | 0.9821 | 0.9777 | 0.9822 | 0.9692 | 0.9733 | 0.9691 | 0.9689 | 0.9746 ± 0.006 |
| Minimum | 0.9688 | 0.951 | 0.9643 | 0.9559 | 0.9425 | 0.9602 | 0.9469 | 0.9557 ± 0.009 |
| Average | 0.9821 | 0.9777 | 0.9822 | 0.9692 | 0.9733 | 0.9691 | 0.9689 | 0.9746 ± 0.006 |
| Product | 0.9688 | 0.951 | 0.9643 | 0.9559 | 0.9425 | 0.9602 | 0.9469 | 0.9557 ± 0.009 |
| Bayes | 0.9688 | 0 | 0.9822 | 0.9604 | 0.9376 | 0.9603 | 0.9469 | 0.9594 ± 0.014 |
| Decision template | 0.9821 | 0.9777 | 0.9822 | 0.9692 | 0.9733 | 0.9691 | 0.9689 | 0.9746 ± 0.006 |
| Dempster shafes | 0.9821 | 0.9777 | 0.9822 | 0.9692 | 0.9733 | 0.9691 | 0.9689 | 0.9746 ± 0.006 |
Table 2. Classification of masses and non-masses using different combining methods of ensemble classifiers.
The classification results of Benign and Malignant cases using different classifiers and ensemble classifier are shown in Tables 3 and 4. The supremacy of ensemble classifiers over individual classifiers is proved in these results.
| Iterations | 1 | 2 | 3 | 4 | 5 | 6 | 7 | Mean ± SD |
|---|---|---|---|---|---|---|---|---|
| MLP | 0.8273 | 0.6558 | 0.6961 | 0.7032 | 0.7712 | 0.7821 | 0.7996 | 0.7479 ± 0.058 |
| KNN | 0.8377 | 0.8676 | 0.8377 | 0.8568 | 0.5321 | 0.7413 | 0.7805 | 0.7791 ± 0.109 |
| SVM | 0.7358 | 0.7015 | 0.8366 | 0.7887 | 0.64 | 0.6688 | 0.7718 | 0.7347 ± 0.064 |
Table 3. Classification of benign and malignant cases using different classifiers.
| Iterations | 1 | 2 | 3 | 4 | 5 | 6 | 7 | Mean ± SD |
|---|---|---|---|---|---|---|---|---|
| Majority voting | 0.8573 | 0.78 | 0.8469 | 0.8377 | 0.7244 | 0.7429 | 0.8099 | 0.7999 ± 0.052 |
| Maximum | 0.7609 | 0.6558 | 0.7614 | 0.7892 | 0.6885 | 0.7636 | 0.781 | 0.7429 ± 0.05 |
| Sum | 0.8573 | 0.78 | 0.8469 | 0.8377 | 0.7244 | 0.7429 | 0.8099 | 0.7999 ± 0.052 |
| Minimum | 0.7707 | 0.6852 | 0.7233 | 0.7892 | 0.6797 | 0.7832 | 0.7712 | 0.7432 ± 0.046 |
| Average | 0.8573 | 0.78 | 0.8469 | 0.8377 | 0.7244 | 0.7429 | 0.8099 | 0.7999 ± 0.052 |
| Product | 0.7707 | 0.6852 | 0.7233 | 0.7892 | 0.6797 | 0.7832 | 0.7712 | 0.7432 ± 0.046 |
| Bayes | 0.8382 | 0.8279 | 0.7794 | 0.7887 | 0.7914 | 0.7914 | 0.7903 | 0.801 ± 0.022 |
| Decision template | 0.8671 | 0.8094 | 0.866 | 0.8377 | 0.7614 | 0.7919 | 0.8099 | 0.8205 ± 0.038 |
| Dempster shafes | 0.8573 | 0.8094 | 0.866 | 0.8377 | 0.7712 | 0.7919 | 0.8099 | 0.8205 ± 0.034 |
Table 4. Classification of benign and malignant cases using different combining methods of ensemble classifiers.
The accuracy of classification of masses and non-masses is more as compared to benign/malignant classification. This is due to the fact that masses and non-masses differ substantially in texture as compared to benign and malignant mammograms.
The results obtained in this proposed work compared with some already works done on segmentation and classification of mammograms is presented in Table 5.
| S. no. | Reference | Methodology | Database | No. of images | Results |
|---|---|---|---|---|---|
| 1 | Duraisamy et al. [20] | Deep learning convolutional | MIAS | 323 | 95% |
| 2 | Shen-Chuan et al. [21] | Complex texture features (ODCM features) | DDSM | 353 | 97.60% |
| 3 | Mencattini et al. [22] | Metrological classification | DDSM | 353 | 88.38% |
| 4 | Székely et al. [23] | Global segmentation | - | 128 | 88-94% |
| 5 | Proposed method | Level based segmentation+ensemble classification | MIAS | 323 | 97.46% |
Table 5. Comparison of the proposed method with results of other research findings.
Discussion and Conclusion
This paper proposes a CAD system for mammographic detection using texture features and ensemble classifiers. Mammograms being fuzzy in nature make the segmentation and detection a difficult task. The pectoral removal along with other pre-processing steps and exact extraction of ROIs are necessary for proper segmentation of mammograms. The segmentation has been successfully executed using Level set segmentation.
The edges are preserved for better classification accuracy. The ensemble classifier based on Bagging algorithm is used and different classifiers are combined using various methods and Dempster Shafes gives the best results. The classifiers used are MLP, k-NN, SVM and ensemble classifiers and their performances are compared. The accuracy of the cancer detection will improve with CAD based diagnostic method. The application of the work is the double reading used by the radiologists. As in manual reading, there can be some intra and inter observational differences.
The computer aided diagnosis systems can help the radiologist for the detection of breast cancer. So the number of unnecessary biopsies and overlook of the potential cancer cases can be reduced to minimum.
With these encouragingly good classification accuracies, this system can be put in clinical trials for fully computerized detection of breast cancer. So the subjectivity associated with human observation can be done away with.
References
- Malvia S, Bagadi A, Dubey US, Saxena S. Epidemiology of breast cancer in Indian women. Asia Pac J Clin Oncol 2017; 13: 289-295.
- Kass M, Witkin A, Terzopoulos D. Snakes: active contour models international. J Comp Vis 1988; 321-331.
- Wolfgang AS. Molecular biology of human cancers: an advanced students textbook 2007th Edn.
- Ghaib HA, Adhami R, Scott M. An overview of mammogram analysis. IEEE Potent 2016.
- Timp S, Varela C, Karssemeijer N. Temporal change analysis for characterization of mass lesions in mammography. IEEE Trans Med Imag 2007; 26.
- Wang Y, Li J, Gaon X. Latent feature mining of spatial and marginal characteristics for mammographic mass classification. Neourocomputing 2014; 144: 107-118.
- Ganesan K, Acharya UR, Chua CK, Min LC, Abraham KC, Kwan-Hoong N. Computer-aided breast cancer detection using mammograms: a review. IEEE Rev Biomed Eng 2013; 6.
- Onega T. Radiologists perceptions of computer aided detection versus double reading for mammography interpretation. Acad Radiol 2010; 17: 1217-1226.
- Rachel FB. Improvement in sensitivity of screening mammography with computer-aided detection: a multiinstitutional trial. Am J Roentgenol 2003; 181: 687-693.
- Gilbert FJ. Single reading with computer-aided detection for screening mammography. N J Engl Med 2008; 359.
- Morton MJ, Dana HW, Kathleen Brandt R, Amrami KK. Screening mammograms: interpretation with computer-aided detection-prospective evaluation. Radiology 2006; 239: 375-383.
- Samulski MR. Using computer aided detection in mammography as a decision support. Eur Radiol 2010; 20: 2323-2330.
- Maitra IK, Nag S, Bandopadhay SK. Technique for pre-processing of digital mammogram. Comp Meth Prog Biomed 2012; 107: 175-188.
- Gonzalez RC, Wood RE. Digital image processing (3rd Edn.) 2008.
- Osher S, Sethian JA. Fronts propagating with curvature-dependent speed algorithm based on Hamilton-Jacobi formulations. J Comp Phys 1988; 79: 12-49.
- Sethian JA. Advancing interfaces: level set and fast marching methods applied mathematical science subprogram of the office of energy research, U.S. Department of Energy, under Contract Number DE-AC0376SF00098, and the office of Naval Research under grant FDN00014-96-1-0381 1999.
- Harlick RM. Textural features for image classification. IEEE Trans Sys Man Cybern 1973 6: 610-621.
- Dietterich TG. Ensemble methods in machine learning. Multiple Classifier Systems. Springer Berlin Heidelberg 2000; 1-15.
- Polikar R. Ensemble based systems in decision making. IEEE Circ Sys Magaz 2006.
- Durasisamy S, Emperumal S. Computer aided mammogram diagnosis system using deep learning convolutional fully complex-valued relaxation neural network classifier. IET Comp Vis 2017; 11: 656-662.
- Tai SC, Chen ZS, Tsai WT. An automatic mass detection system in mammograms based on complex texture features. IEEE J Biomed Health Inform 2014; 18.
- Mencattini A, Salmeri M, Rabottino G, Sailicone S. Metrological characterization of a CADx system for the classification of breast masses in mammograms. IEEE Trans Instrument Measure 2010; 59.
- Székely N, Toth N, Pataki B. A hybrid system for detecting masses in mammographic images. IEEE Trans Instrument Measure 2006; 55.