Research Article - Biomedical Research (2017) Volume 28, Issue 3
Characterization of the T cell receptor repertoires during pregnancy
Hanshi Xu1,2, Changxi Wang2, Xiao Liu2, Yi Zhao2 and Wei Zhang2*1Department of Life Sciences, University of Chinese Academy of Sciences, Beijing, China
2BGI-Shenzhen and Shenzhen Key Laboratory of Transomics Biotechnologies, BGI-Shenzhen, Shenzhen, China
- *Corresponding Author:
- Wei Zhang
BGI-Shenzhen and Shenzhen Key Laboratory of Transomics
Biotechnologies, China
Accepted on July 28, 2016
Abstract
High Throughput Sequencing (HTS) is a feasible approach for characterizing T-Cell Receptor (TCR) repertoire, and this technology has been applied in various diseases. For a pregnant woman, immunologic balance may be interrupted when the foetus grow up. How to adjust the mother’s immune system and what’s the difference before and after pregnancy are limited known. Herein, we use the multiplex PCR method to amplify TCR-β repertoire for both pregnant women and non-pregnant women. Total 12 samples are sequenced by HTS which produce on average 6.43 million sequences for each sample. We observe that the repertoire diversity and CDR3 number tend to decline slowly in gestation period. The content of high-frequency is found remarkably expended at the second trimester and then shrunken at the third trimester. Pregnant samples are clustered together and non-pregnant samples are clustered to another group using both V genes and V-J pairings. Furthermore, seven V genes which are significantly different between two groups are identified. Finally, high-frequency clones of a pregnant woman are visualized among three time-point pregnancies. Our study can provide new insight into understanding the immune response during the pregnancy, and the repertoire characteristics would provide a reference for other investigators.
Keywords
TCR repertoire, Pregnancy, High throughput sequencing, Immune.
Introduction
T cell plays an important role in immune system. It is involved in autoimmunity, cancer therapy and protecting against infections. T Cell Receptor (TCR) is a dimer protein presented on the surface of T cell. It can recognize the invading antigen presented by Major Histocompatibility Complex (MHC), and trigger the activation of T cells. TCR is generated by recombination of Variable (V) Diversity (D) and Joining (J) gene segments. At the same time, some nucleotides are deleted randomly at the 3’ V, 5’D, 3’D and 5’J gene, and non-template nucleotides are inserted between V-D and V-J junction region [1,2]. There are more than 50 V gene segments, 2 D gene segments and 13 J gene segments for human reported in IMGT database. Hence, those multiple genes recombination and diverse insertion/deletion nucleotides result in a huge amount of TCRs diversity. It is predicted that the potential TCR diversity reach to 1018 in theory [3]. Actually, over 1 million different CDR3 sequences were observed in human blood [1].
Currently, TCRs can be amplified by multiplex PCR technology and sequenced by high throughput sequencing or Next Generation Sequencing (NGS). This technology has a variety of applications, such as infectious disease [4], autoimmune disease [5], vaccine [6] and cancer research [7]. Foetus, as a semi-antigen can activate maternal immune cells and maternal tolerance is critical to prevent foetal abortion [8].
Several researches focused on the function of regular T (Treg) cell in mouse model during pregnancy [9-11]. Some other researchers have reported the importance of Treg cell in human decidua or/and blood [12,13]. Although a paper showed interest in T cell changes during pregnancy [14], only traditional PCR method was used. We think that using NGS technology to track the T cell repertories changes during pregnancy can provide another perspective to understand pregnancy process.
In this article, we focused on the changes of TCR-β repertoires during pregnancy. Both non-pregnant women and pregnant women were used in this research. TCR-β repertoire was amplified by multiplex PCR and then was sequenced by Illumina NGS platform. We showed the changes and the diversities for both CDR3 and V-J pairing during pregnancy. The number of CDR3 in pregnant women went down at first and became stable until it reached half number of which in non-pregnant women. The frequency variation of CDR3 was divided into four parts and we found the highly expanded clones seemed to further expand at the second trimester and then decrease at the third trimester. Samples of pregnant were clustered together using correlation of both V genes and V-J pairings. Furthermore, we found remarkably different V genes and V-J pairings usage between the non-pregnant and pregnant groups. Finally, high-frequency clones of a pregnant woman were visualized among three time point pregnancies to reflect their dynamic changes.
Materials and methods
Blood samples
The pregnant donors were recruited voluntarily, and diagnosed without disorders or infections. Gestation weeks for all the pregnant donors (PW1, PW2 and PW3) were diagnosed by doctors. Samples of peripheral blood mononuclear cells (PBMCs) at seven time points were collected. PW1 was at the 4th (p1), 5th (p2) and 8th (p3) week. PW2 was at the 9th (p4) and 30th (p7) week. PW3 was at the 15th (p5) and 23rd (p6) week. These pregnant women gave birth to healthy babies. We also collected samples of PBMCs from other five recruited health female donors (np1, np2, np3, np4, np5) who were all self-proclaimed healthy and diagnosed non-pregnancy. Another sample of PBMC from np6 was recruited to evaluate the robust of multiplex PCR, who was self-proclaimed healthy as well. That sample was an independent sample and did not be used in further analysis. The study was approved by the Institutional Review Board at and BGI-Shenzhen and written informed consents were obtained from these donors.
Library preparation and high throughput sequencing
All gDNA from PBMCs were extracted with a QIAamp DNA Blood Mini Kit, and 1ug gDNA was collected for the further PCR. The third complementarity determining (CDR3) regions of TCR beta were amplified by multiplex PCR and sequenced using methods described previously [15]. We used 30 forward primers annealed to the FR3 region of TCR and 13 reverse primers annealed to the junction (J) region in order to enrich the maximum possible CDR3. The cycling conditions were as follows: 98˚C at 30 min for warming up, 30 cycles at 94˚C for 30 sec, 60˚C for 90 sec, and 72˚C for 30 sec, adding 98˚C at 30 min for extension finally. The target amplified fractions less than 180 bp and more than 110bp were kept and purified for sequencing. We sequenced these products using Illumina Hiseq 2000 platform following the manufacturer’s protocol strictly. Raw reads from 2.9 M to 9.6 M were generated, which were pair end 100 bp.
Analysing of the sequencing data
All these TCR sequencing data were analysed using TCR and BCR repertoire analysing pipeline iMonitor [15]. The brief process was that: firstly, low-quality sequence was discarded and Paired-End (PE) reads were merged by their overlapping nucleotides. Secondly, V, D and J gene segments were assigned by BLAST alignment and further re-alignment, where VDJ germline genes from IMGT database were as the reference for alignment. Thirdly, sequencing error was corrected, and CDR3 region, deletion and insertion were identified. Finally, some statistics and visualizations were done for each sample. The diversity of repertoire was evaluated by Shannon Index. In order to eliminate the effect of different sequencing depth of all these libraries, we normalized each sample by selecting randomly the same amount of sequences for further analysis. Additionally, low-frequency sequence (CDR3 abundance<3) was discarded to reduce the effect of sequencing error.
R (version 3.1.0) and ggplot2 package were used to do the statistical analysis and figure painting. We did unpaired two-tailed t-test for the CDR3 number between the pregnant group and non-pregnant group. Two-tailed Wilcox test was used for compare the different usage of V gene number. In order to get high confident result, the V gene usage number divided by total V gene usage number greater than three divided by V gene species number in either groups was left for calculating significance. We calculated Pearson’s correction coefficient between two libraries from the same individual (np6). Among all the tests, p-value<0.05 was treated as significant.
This research was reviewed and approved by a duly constituted ethics committee (the Institutional Review Board on Bioethics and Biosafety of BGI).
Result
Reproducibility assessment for multiplex PCR
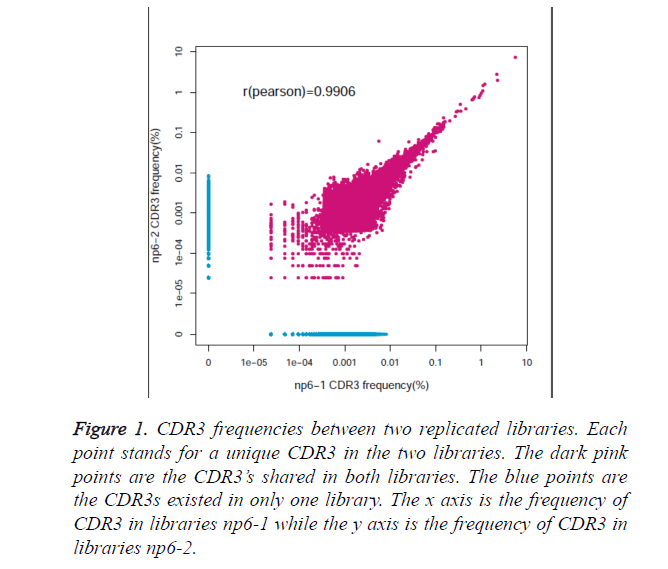
To test whether the Multiplex PCR (MPCR) method was replicable, a healthy individual was used to assess the technological reproducibility. We utilized two equivalent amount of DNA to prepare for MPCR amplification separately. We sequenced the two libraries using Illumina and processed the raw data by iMonitor [15]. The same amount of effective data was randomly selected to compare CDR3 frequency distribution between the replicates. We compared the frequency of all the CDR3 clonotype from the two samples and calculated Pearson’s correlation coefficient between them. Figure 1 shows the all CDR3 frequency distribution for those two samples. The dark pink points stand for the CDR3’s observed on both replicates while the blue ones represent the CDR3 existed at only one sample. The frequencies are similar for most CDR3 and the Pearson’s correlation coefficient reach to 0.9906, which demonstrates that clone reproducibility for this method is good. Additionally, the high frequency of CDR3, more than 0.01%, can be replicable. Therefore, the CDR3 clone with high frequency of above 0.01% is consistent during detection in this experiment. Those results demonstrate that the method is replicable, sensitive and reliable.
Figure 1. CDR3 frequencies between two replicated libraries. Each point stands for a unique CDR3 in the two libraries. The dark pink points are the CDR3’s shared in both libraries. The blue points are the CDR3s existed in only one library. The x axis is the frequency of CDR3 in libraries np6-1 while the y axis is the frequency of CDR3 in libraries np6-2.
Diversity analysis for both non-pregnant and pregnant samples
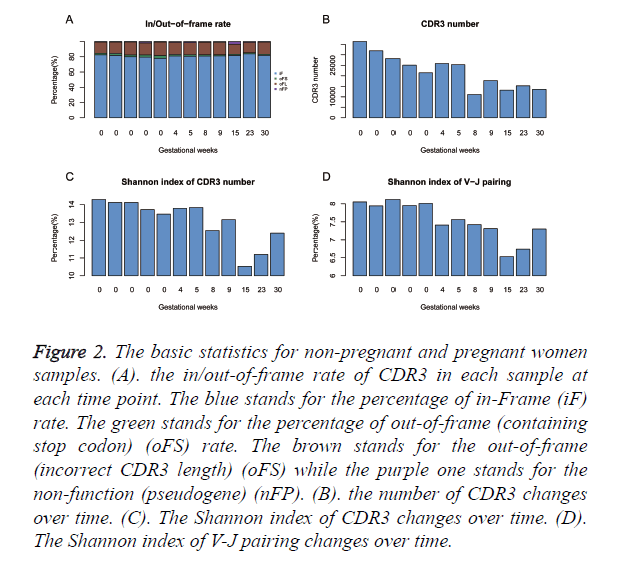
The diversity of TCR repertoire can be reflected by the diversity of its highly variable CDR3. Thus, our analysis focus on CDR3 sequences. We did basic statistical analysis on the constitution of CDR3, the number of CDR3, Shannon index for CDR3 and of V-J gene pairing usage as shown in Figure 2. The in-frame (with the correct open reading frame) rate of clones is nearly 80% for all samples. The rest of clones (~ 20%) are observed with CDR3 nucleotide length that is not equal to multiple of three. Few clones embedded stop codons or derived from V/J pseudogene. However, no difference is observed between the non-pregnant women and the pregnant women or just in pregnant women as shown in Figure 2A. The CDR3 numbers vary from sample to sample and the difference between non-pregnant and pregnant women is obvious as shown in Figure 2B. The mean CDR3 number in non-pregnant woman group is nearly 27000 compared with 17500 in the pregnant women group (p=0.021, unpaired t-test). For the pregnant woman group, the CDR3 number tends to decline along with the increment of the gestation period. From 9th week to 30th week, the number seems to be fluctuated from 13000 to 17000, which is nearly half ratio of non-pregnant samples. Besides, we calculated the Shannon index for CDR3 as shown in Figure 2C and V-J pairing as shown in Figure 2D for each sample. The Shannon index of CDR3 varies from 14.29 to 13.47 in non-pregnant group. In the first trimester (from week 0 to 5th week), the Shannon index is close to the non-pregnant group; it tends to decrease in the second trimester and to increase in the third trimester. The Shannon index of V-J pairing reveals the same trend with the exception that it is declined in the 4th ~ 5th week. Those results show the overall immune status of the non-pregnant and the pregnant women, together with its changes in gestation period.
Figure 2. The basic statistics for non-pregnant and pregnant women samples. (A). the in/out-of-frame rate of CDR3 in each sample at each time point. The blue stands for the percentage of in-Frame (iF) rate. The green stands for the percentage of out-of-frame (containing stop codon) (oFS) rate. The brown stands for the out-of-frame (incorrect CDR3 length) (oFS) while the purple one stands for the non-function (pseudogene) (nFP). (B). the number of CDR3 changes over time. (C). The Shannon index of CDR3 changes over time. (D). The Shannon index of V-J pairing changes over time.
Change in the high frequency TCR’s during pregnancy
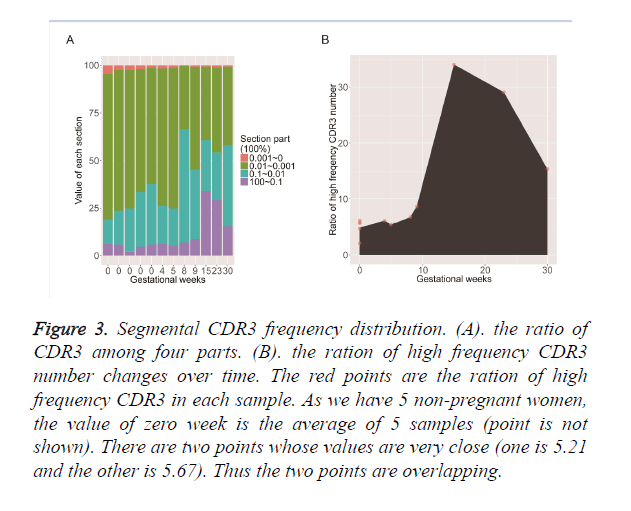
To test the clone frequency distribution during pregnancy, we divided the total CDR3’s into 4 segments by their frequency: high frequency ≥ 0.1%, relative high frequency 0.01% ~ 0.1%, relative low frequency 0.001% ~ 0.01%, and low frequency <0.001% as shown in Figure 3A. We found clones with relative low frequency accounted for the majority of the repertoire while clones with high frequency accounted for a small part. The relative-low-frequency part in the non-pregnant samples was higher than in the pregnant group. On the contrary, the high frequency part revealed the opposite trend. The high frequency clones were less influenced by the sequencing errors and reflected the expanded clones, so we further investigated their frequency change along with the increment of the gestation time as shown in Figure 3B. The total percentage of high-frequency clones accounts for 5% on average in the nonpregnancy samples; the percentage slightly increases from 0th week to 8th week in the pregnancy; it tends to increase sharply from 10th to 17th week and is up to 34% in the 17th week; later on, it tends to decline smoothly and the percentage is 15% at the 30th week. However, the percentage in 30th week is still 3 times larger than the one in 0th week. This process explains that the immune system is simulated by some kind of antigens in the second trimester and then gets tolerated when the gestation time increase. The change is similar for the Shannon index of CDR3 and V-J pairing. It might be that the embryo is treated as extraneous material at first stage and the maternal immune system is tolerated to the embryo later.
Figure 3. Segmental CDR3 frequency distribution. (A). the ratio of CDR3 among four parts. (B). the ration of high frequency CDR3 number changes over time. The red points are the ration of high frequency CDR3 in each sample. As we have 5 non-pregnant women, the value of zero week is the average of 5 samples (point is not shown). There are two points whose values are very close (one is 5.21 and the other is 5.67). Thus the two points are overlapping.
Convergent V gene and V-J pairing usage was observed in the pregnant samples
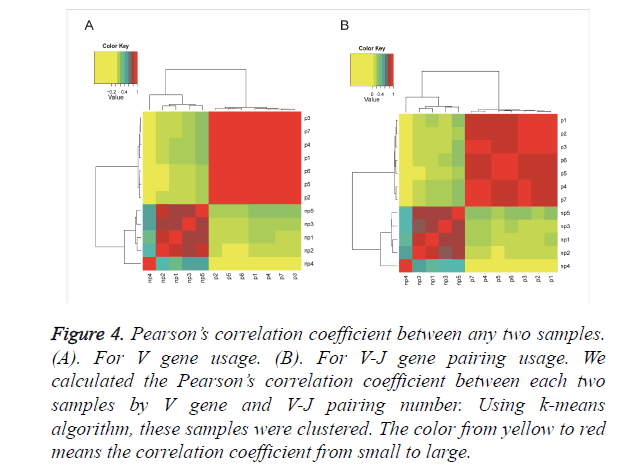
To see whether non-pregnant and pregnant groups have different V gene and V-J gene pairing usage, we compared the gene usage among all samples. We calculated the correlation coefficient of V gene usage between any two samples and showed them in Figure 4A by heatmap. The correlation coefficients between non-pregnant samples range from 0.2 to 0.8 while they are all above 0.8 between the pregnant samples. It demonstrates that the samples in pregnant group are more similar in the V gene usage than the non-pregnant samples. Furthermore, we clustered those samples by correlation coefficients. The pregnant group seems to be clustered together, as well as the non-pregnancy group. For V-J gene pairings, we did the same processing as shown in Figure 4B. The result is similar to the V gene usage that higher similarity is observed among pregnant samples. Although the correlation coefficients of V-J pairing are much lower than those of V genes, the pregnant samples are also clustered to one group. However, some details are different from V gene usage. In V-J gene pairing usage cluster, p1, p2 and p3 have close relationship, p5 and p6 are close to each other and p4 and p7 are clustered while the V gene usage cluster has different relationship. In V gene cluster p3, p7, p4 and p1 have close relationship while the p6, p5 and p2 are similar to each other. It suggests that the TCR repertoire in the pregnancy tends to use similar V and J genes for recombination.
Figure 4. Pearson’s correlation coefficient between any two samples. (A). For V gene usage. (B). For V-J gene pairing usage. We calculated the Pearson’s correlation coefficient between each two samples by V gene and V-J pairing number. Using k-means algorithm, these samples were clustered. The color from yellow to red means the correlation coefficient from small to large.
V gene usage preference in the pregnancy
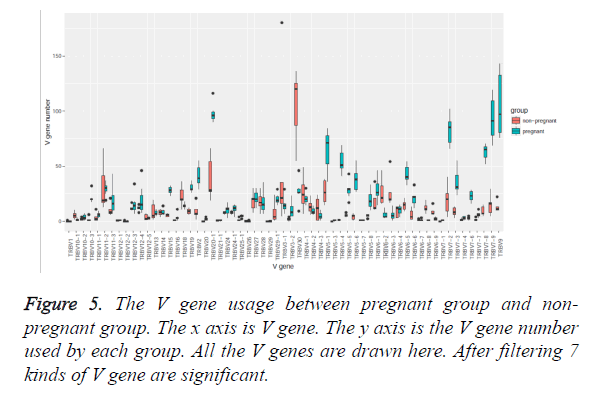
As V gene usage is observed to be different between pregnant group and non-pregnant group, we intended to figure out which V gene usage is remarkable. To illustrate that, a bar plot was drawn for each V gene usage as shown in Figure 5. We did Wilcox test for V gene usage between the non-pregnant and the pregnant samples, and more than half of V genes are not significantly different. The result shows that there are 7 V genes, which are TRBV7-9, TRBV20-1, TRBV7-8, TRBV9, TRBV6-5, TRBV7-2 and TRBV30 existing preference in gene usage after removing the genes with very low usage. Using the same method, 83 kinds of V-J pairing are significant (Figure is not shown). It indicates that these kinds of V genes and V-J pairing may have some function to help maternal immune system deal with the foetus.
The frequency of highly expanded clones change over time
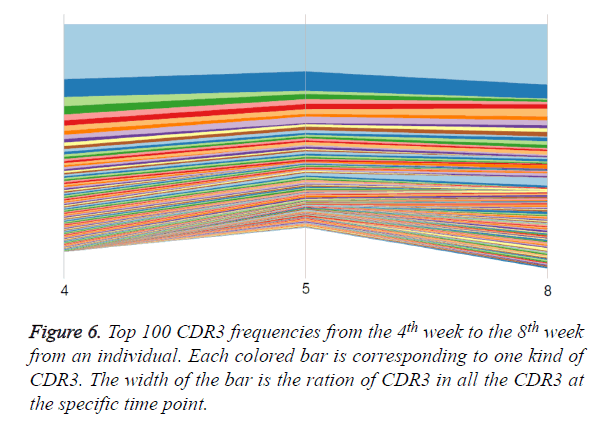
To track the change of CDR3 during pregnancy, we plotted the top 100 CDR3 from the 4th week 5th week and 8th week from one individual. The trajectory was drawn for every CDR3 changes during these weeks. The result shows that the top 100 CDR3 are similar among the three time points. The Pearson correlation coefficient between the 4th and the 5th is 0.979, between the 4th and the 8th is 0.950, and between the 5th and the 8th is 0.951. With time goes by, the similarity between the 4th week and the 5th week is more closed than that between 5th week and 8th week. Some low-frequency CDR3s in 5th week are slightly expanded in 8th week. However, top 100 CDR3 frequencies are very stable among the three time periods (Figure 6).
Discussion
In this study, we investigated the feature of TCR repertories in pregnancy. We used an independent sample to demonstrate the reproducibility of our multiplex PCR method to enrich the TCR repertoire. We did analysis on in/out-of-frame rate of clones in non-pregnancy and pregnancy groups. The number of CDR3 was calculated for each sample. The diversity is an important factor to reflect whether the immune system is activated or not. We used Shannon index of CDR3 and V-J gene pairing usage to evaluate the diversity. We also selected the high frequency CDR3 to track their dynamic frequency changes. V and V-J gene pairing usage was used to cluster the pregnancy group. We selected the top 100 CDR3 for tracking their expended.
Our study indicated that TCR did change during pregnancy and preferred to use some kind of V gene or V-J gene pairing. We found that the number of CDR3 increased at the second trimester and declined at the third trimester. It is possible that the antigen of foetus activates the T cell repertoire in the second trimester and is restrained later. The number and Shannon index of CDR3 doesn’t show much difference between the non-pregnancy and 4th, 5th and 8th week of pregnancy. The V gene and V-J gene pairing usage reveal significant difference between non-pregnant and pregnant samples. We suspect that the V or V-J gene pairing usage may be regulated by hormones, as the hormones changes from the very beginning of the pregnancy and may help prevent abortion [16,17]. Based on our findings in this research, we suspects that some kind of hormone change V or/and V-J gene pairing bias of T cell from very beginning of the first trimester of pregnancy [18], the foetus actives the T cell, and the maternal immune system gets tolerate of the foetus [10] during pregnancy.
Although some significant findings are observed in our study and small samples are trustable by analysing TCR repertoires [19,20], larger samples are required for further validation. Additionally, our study could be improved if the same pregnant woman is monitored from the time prior to pregnancy to the day giving birth to babies. Tracking the CDR3 change of an individual during the whole pregnant process will eliminate the heterogeneity among people. However, we believe our findings here can provide a reference for other investigators.
References
- Warren RL, Freeman JD, Zeng T, Choe G, Munro S, Moore R. Exhaustive T-cell repertoire sequencing of human peripheral blood samples reveals signatures of antigen selection and a directly measured repertoire size of at least 1 million clonotypes. Genome Res 2011; 21: 790-797.
- Robins H. Immunosequencing-applications of immune repertoire deep sequencing. Curr Opin Immunol. Elsevier 2013; 25: 646-652.
- Venturi V, Price D a, Douek DC, Davenport MP. The molecular basis for public T-cell responses. Nat Rev Immunol 2008; 8: 231-238.
- Parameswaran P, Liu Y, Roskin KM, Jackson KKL, Dixit VP, Lee JY. Convergent Antibody Signatures in Human Dengue. Cell Host Microbe 2013; 13: 691-700.
- Tipton CM, Fucile CF, Darce J, Chida A, Ichikawa T, Gregoretti I. Diversity, cellular origin and autoreactivity of antibody-secreting cell population expansions in acute systemic lupus erythematosus. Nat Immunol 2015; 16: 755-765.
- Vollmers C, Sit R V, Weinstein JA, Dekker CL, Quake SR. Genetic measurement of memory B-cell recall using antibody repertoire sequencing. Proc Natl Acad Sci 2013; 110: 13463-13468.
- Han Y, Liu X, Wang Y, Wu X, Guan Y, Li H. Identification of characteristic TRB V usage in HBV-associated HCC by using differential expression profiling analysis. Oncoimmunol 2015; 4: 1021537.
- Williams Z. Inducing Tolerance to Pregnancy. N Engl J Med 2012; 367: 1159-1161.
- Shima T, Inada K, Nakashima A, Ushijima A, Ito M, Yoshino O. Paternal antigen-specific proliferating regulatory T cells are increased in uterine-draining lymph nodes just before implantation and in pregnant uterus just after implantation by seminal plasma-priming in allogeneic mouse pregnancy. J Reprod Immunol Elsevier Ireland 2015; 108: 72-82.
- Kahn DA, Baltimore D. Pregnancy induces a fetal antigen-specific maternal T regulatory cell response that contributes to tolerance. Proc Natl Acad Sci USA 2010; 107: 9299-9304.
- Woidacki K, Meyer N, Schumacher A, Goldschmidt A, Maurer M, Zenclussen AC. Transfer of regulatory T cells into abortion-prone mice promotes the expansion of uterine mast cells and normalizes early pregnancy angiogenesis. Sci Rep Nature Publ G 2015; 5: 13938.
- Neller MA, Santner-Nanan B, Brennan RM, Hsu P, Joung S, Nanan R. Multivariate analysis using high definition flow cytometry reveals distinct t cell repertoires between the fetal-maternal interface and the peripheral blood. Front Immunol 2014; 5: 33.
- Tilburgs T, Roelen DL, van der Mast BJ, de Groot-Swings GM, Kleijburg C, Scherjon SA. Evidence for a selective migration of foetus-specific CD4+CD25 bright regulatory T cells from the peripheral blood to the decidua in human pregnancy. J Immunol 2008; 180: 5737-5745.
- Braslau N, Brooks MB. Time course analysis of a+b+T cell clones during normal pregnancy. IEEE Trans Electron Devices 1994; 41: 834-838.
- Zhang W, Du Y, Su Z, Wang C, Zeng X, Zhang R. Imonitor-A robust pipeline for TCR and BCR repertoire analysis. Genetics 2015; 201: 459-472.
- Shim SH, Ha HI, Jung YW, Shim SS, Cho YK, Kim JY. Maternal antimullerian hormone as a predictor of foetal aneuploidy occurring in an early pregnancy loss. Obstet Gynecol Sci 2015; 58: 494.
- Morley LC, Simpson N, Tang T. Human chorionic gonadotrophin (hCG) for preventing miscarriage. Cochrane database Syst Rev 2013; 1: 008611.
- Makrigiannakis A, Zoumakis E, Kalantaridou S, Coutifaris C, Margioris AN, Coukos G. Corticotropin-releasing hormone promotes blastocyst implantation and early maternal tolerance. Nat Immunol 2001; 2: 1018-1024.
- Neller MA, Burrows JM, Rist MJ, Miles JJ, Burrows SR. High frequency of herpesvirus-specific clonotypes in the human T cell repertoire can remain stable over decades with minimal turnover. J Virol 2013; 87: 697-700.
- Sherwood AM, Desmarais C, Livingston RJ, Andriesen J, Haussler M, Carlson CS. Deep sequencing of the human TCR and TCR repertoires suggests that TCR rearranges after and T Cell commitment. Sci Transl Med 2011; 3: 90ra61.
