Research Article - Biomedical Research (2017) Volume 28, Issue 9
Can diffusion weighted magnetic resonance imaging (DW-MRI) be an alternative to 18f-FDG PET/CT (18f fluorodeoxyglucose positron emission tomography) in nasopharyngeal cancers?
Ismail Okan Yildirim*1, Kemal Ekici2, Metin Doğan1, Öztun Temelli2, Ersoy Kekilli3, Semih Saglık1, Fatih Erbay1 and Aylin Comak3
1Department of Radiology, Inonu University School of Medicine, Malatya, Turkey
2Department of Radiology Oncology, Inonu University School of Medicine, Malatya, Turkey
3Department of Nuclear Medicine, Inonu University School of Medicine, Malatya, Turkey
- *Corresponding Author:
- Ismail Okan Yildirim
Department of Radiology
Inonu University School of Medicine, Turkey
Accepted on March 14, 2017
Abstract
Objective: This study aimed to evaluate correlations, if any, between the ADC (Apparent Diffusion Coefficient) measurements in MRI (Magnetic Resonance Imaging) and SUV max (Standardized Uptake Value) in 18F-FDG PET/CT in patients with nasopharyngeal cancers and to investigate whether DWMRI (Diffusion Weighted MRI) can be an alternative to 18F-FDG PET/CT in the evaluation of the response to treatment and prognosis in those patients.
Methods: This study was performed between January 2015 and February 2016 at Inonu University Medical Faculty, Department of Radiology on 22 patients who were diagnosed with nasopharyngeal cancer by histopathological evaluation at Department of Pathology of the same faculty. Diffusion weighted images were obtained using 1.5 T MRI in all patients. 18F-FDG PET/CT images were obtained approximately 1-2 weeks after the diffusion-weighted images.
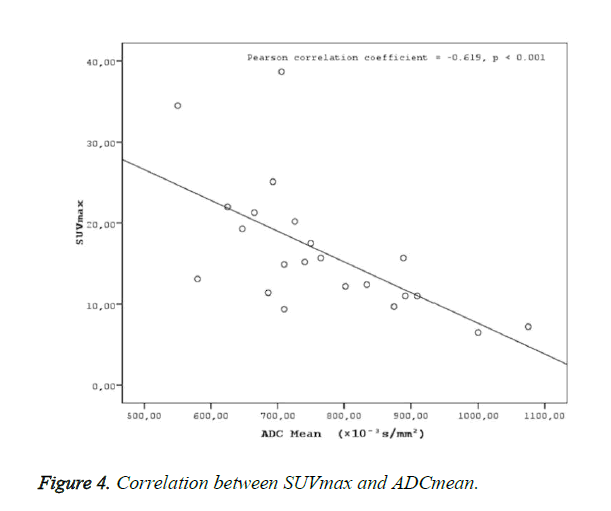
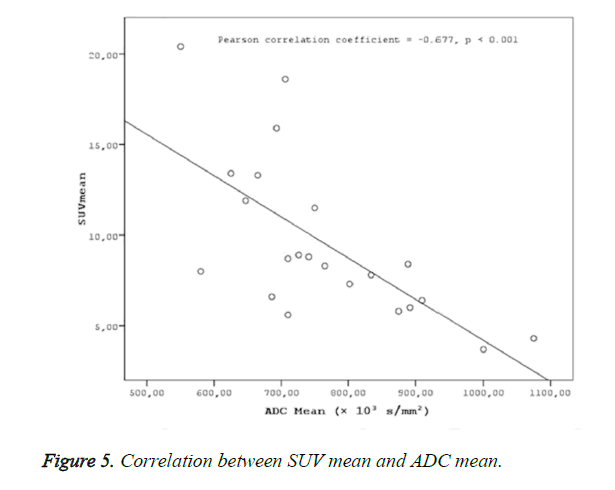
Results: Two groups were created according to the histological subtypes as keratinized (n: 8) and nonkeratinized (n:14) among the 22 cases with a definitive histopathological diagnosis of nasopharyngeal cancer. No statistical difference was found between the groups in terms of SUVmax, SUVmean and ADC mean values (p>0.05). ADC mean values measured in patients with nasopharyngeal cancer were statistically significantly and negatively correlated with SUV max (r=-0.619, p<0.001) and SUV mean values (r=-0.677, p<0.001).
Conclusion: Even though there are anatomic and patient-related limitations of the DW-MRI in nasopharyngeal cancers, we suggest that it may be a complementary and alternative method of 18F-FDG PET/CT in the evaluation of treatment response and prognosis detection in nasopharyngeal cancers.
Keywords
Nasopharyngeal Cancer, Diffusion weighted magnetic resonance imaging (DW-MRI), 18F-FDG PET/CT.
Introduction
Nasopharyngeal cancers are rarely seen tumors in which diagnosis, treatment, and staging is challenging due to the anatomic localization of the tumor [1]. Nasopharyngeal cancers are radiosensitive, and thus the standard type of treatment is radiotherapy, and chemotherapy has also been reported to increase the duration of survival [2]. Although CT and MR imaging methods have been used in general in the selection of appropriate therapy and evaluation of post-treatment changes, the sensitivity and specificity of 18F-FDG PET/CT has been reported to be higher [3]. Although tumor volume and morphological changes in the tumor can be detected by standard MR in nasopharyngeal cancers, the prediction of tumor response to radiotherapy or chemotherapy is unclear [4]. Therefore 18F-FDG PET/CT imaging performed prior to radiotherapy and chemotherapy has been considered to be a new biomarker in the prediction of treatment response in nasopharyngeal cancers and it is a functional method of imaging that has been used in the staging of tumor in oncology [5,6].
The standardized uptake value (SUV) used in 18F-FDG PET/CT is a semi-quantitative value of 18F-FDG. SUV provides an opportunity to evaluate the tumor glucose metabolism. Since the tumor cells have a faster metabolism, 18F-FDG is held for a longer time in those cells and thus the location of the tumor tissue can be viewed [7]. Also, the SUV values measured in the PET CT, have simultaneously been suggested to reflect the cellular proliferation, metabolic activity and aggression of the tumor in many studies [8-12].
Even though the 18F-FDG PET/CT has many beneficial uses in the detection of the tumor and the evaluation of its metabolic activity, it has some disadvantages, such as patient exposure to high doses of radiation, high cost of the application, and lesser availability of the application compared to MRI and CT.
Many studies have been recently published demonstrating that diffusion MR, as an alternative to 18F-FDG PET/CT, yields similar anatomic and functional details, which suggests a trend towards this method that includes decreased radiation exposure [13-15].
On the other hand, DWI provides valuable information about the cellular structure and biological specifications of the tissues. It is a non-invasive method of imaging to evaluate the biological characteristics of the tissues. The diffusion coefficient is the measurement of mobility in a molecular level. The ADC value measured on the ADC map, obtained from the DWI's, reflects the absolute magnitude of diffusion. The diffusion rate decreases with the increased cellular density, tumor cellularity, and nucleus/cytoplasm rate, and the ADC values are lowered. ADC values have been found to be inversely correlated with tumor cellularity in both animal and human models in tumor staging and the evaluation of the response to treatment in the meta-analyses performed [16-21]. Similarly, in nasopharyngeal cancers, ADC values were demonstrated to be negatively correlated with the histological tumor stage and ADC values might be used as a non-invasive prognostic factor [22]. ADC values also provide useful information in the evaluation of an early response to treatment in chemotherapy [23].
ADC and SUV values reflect cellular density and metabolic activity, respectively, and thus it is suggested that these two parameters might be correlated. Although this association has been demonstrated in studies of the cervix, rectum, breast cancer, and lymphoma, the association of these two parameters and nasopharyngeal cancer has yet to be demonstrated. DW-MRI, which includes no radiation, might be suggested to be an alternative to PET/CT in staging and the evaluation of the response to treatment in nasopharyngeal cancers if this kind of an association can be demonstrated.
Material and Methods
Patients
This prospective study was conducted between January 2015 and February 2016 at Inonu University’s Department of Radiology, on a total of 28 patients, including 16 males and 12 females, with 11 keratinized and 17 non-keratinized nasopharyngeal cancers, which were detected as a result of histopathological evaluations at the Department of Pathology of the same university. The mean age of the cases was 41 ± 14 years. Patients who received no radiotherapy or chemotherapy and had stage I (n: 8), stage II (n: 9), and stage III (n: 5) tumors according to the World Health Organization (WHO) criteria were included in the study. Six patients were excluded from the study of which two were due to the sensitivity artifact caused by metallic tooth implants and four were due to motion artifacts caused by swallowing or speaking. This study was approved by the Ethics Board of the Medical School of Inonu University
MRI protocol
MR sequences were obtained using a 1.5 T MRI device (Symphony, Siemens Medical System, Erlangen, Germany) in all patients. The images were obtained starting from the supracellular region to the end of the clavicle using head and neck coils. Axial plane fast spin echo T1 (TR: 489 ms, TE: 8.7 ms, FoV: 240 mm, NEX: 3, Matrix: 230 × 384, Cross-Section thickness: 4 mm, FA: 1500, Bandwidth: 250 Hz/Pixel) and fast spin echo T2 (TR: 4285, TE: 91, FoV: 240 mm, NEX: 2, Matrix: 269 × 384, Cross-Section thickness: 4 mm, FA: 1500, Bandwidth: 255 Hz/Pixel), and axial, coronal, and sagittal plane T1-weighted fat-suppressed weighted images (TR: 826, TE: 16, FoV: 240 mm, NEX: 2, Matrix: 269 × 384, Cross- Section thickness: 4 mm, FA: 1500, Bandwidth: 255 Hz/Pixel) following i.v. injection of contrast material (0.1 mmol/kg gadopentetate dimeglumine {Magnevist; Schering, Berlin, Germany) were obtained.
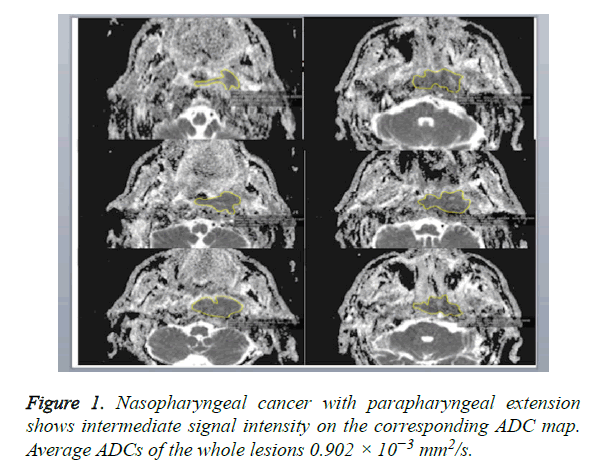
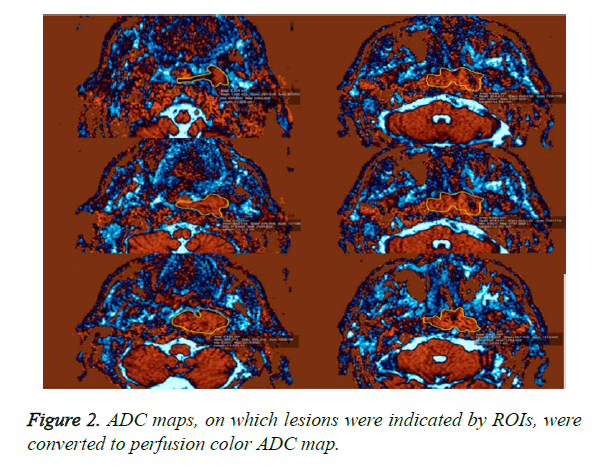
A DW-MRI study was conducted before contrast enhanced sections were obtained. DW-MRI sequences were obtained from the axial plane echo planar spin echo T2. Diffusion weighted images were obtained at 1000/mm2 and b values with EPI technique. The parameters of diffusion weighted images were: TR: 3900, TE: 95, FoV: 250 mm, NEX: 3, Matrix: 230 × 384, cross-section thickness: 4 mm, bandwidth: 300 Khz. ADCs were determined on tumor-by-tumor (overall ADCs) and pixel-by-pixel (ADC mapping) bases. Gray-scale ADC map images were saved in DICOM format. Freehand ROIs along the margins of the lesions were manually placed onto the ADC maps by using the corresponding fat-suppressed T2- weighted MR images as references for placing the ROIs. Then, average ADCs of the whole lesions were determined (overall ADCs) (Figure 1). For ADC mapping, the gray-scale ADC maps, on which lesions were indicated by ROIs, were converted to perfusion color ADC map (Figure 2). These procedures were performed on a personal computer by using Osiri XMD software (http://www.osirix-viewer.com/) [24]. Reproducibility of ADC measurements is a critical factor. Gordon et al. reported that MR imaging-based volume measurements of pharyngeal carcinomas are reliably reproducible, with a mean percentage error of 12% for the measurements. Therefore, poor reproducibility in the placement of ROIs would greatly affect the reliability of the ADC measurement [25]. For the measurements, ADC values were measured, which was manually placed by two radiologists who had no information of the clinical data and had 10 years of experience in order to minimize intraobserver and interobserver variability for DWI measurements, resulting in less than 5% variability.
18F-FDG PET/CT protocol
18F-FDG PET/CT images were obtained using a hybrid PET/CT scanner (Biograph MCT, Siemens, Erlanger, Germany). Patients were required to fast for at least 6 h before the imaging procedure and blood glucose levels were checked to determine whether or not they were less than 150 mg/dl. Oral or intravenous contrast agents were not administered to the patients. 18F-FDG PET/CT imaging was performed 1 h after an intravenous injection of 8-10 mCi (296-370 MBq) 18F-FDG while the patients were in a supine position. During the waiting period, the patients rested in a quiet room without the administration of any muscle relaxant. PET images were obtained for 4 min/bed position. The patients were allowed to breathe normally during the procedure.
PET CT, and fused PET/CT images were analyzed on a Workstation (Siemens Syngo.via (version VA11B_HF03) workstation) to measure the SUV. SUV of each voxel was calculated according to the Equation.
SUV=measured radioactivity concentration (Bq/mL)/Injected radioactivity [Bq]/(lean body mass (kg) × 1000)
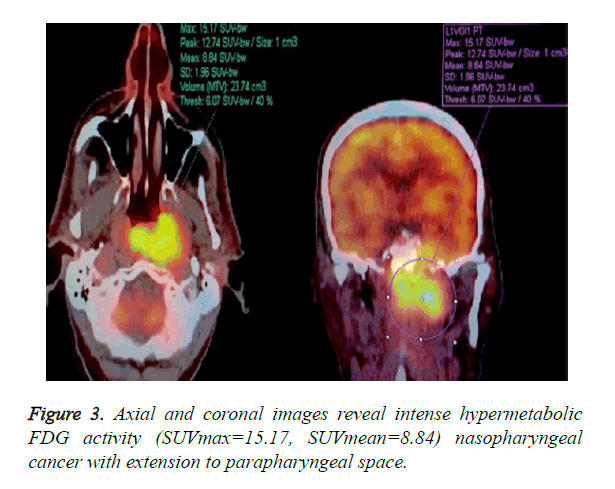
3D ROI was placed over each lesion in PET/CT work station by two Nuclear Medicine Physicians who was blinded to the MRI results. Maximum standardized uptake value in the 3D ROI was designated as SUVmax. The lesion volume was automatically defined using fixed threshold value of 50% of the maximum uptake. The SUVmean was then calculated as the average of SUV values in all voxels within the threshold-defined tumor volume (Figure 3).
Statistical analysis
Statistical analysis was performed using the SPSS 15 (Statistical Package for Social Sciences) program.
The one-way ANOVA test was performed in the comparison of the groups and Pearson’s correlation coefficient was used to evaluate the association of all quantitative parameters.
Results
Two groups were created according to the histological subtypes as keratinized and non-keratinized among the 22 cases with a definitive histopathological diagnosis of nasopharyngeal cancer. Eight cases were histopathologically diagnosed with “keratinized” and 14 cases histopathologically diagnosed with “non-keratinized” were included in the first and second group, respectively. SUVmax, SUVmean, and ADC mean values were compared between the groups and no significant differences were found in those values between the groups (p>0.05) (Table 1).
| Group 1 (n=8) |
Group 2 (n=14) |
p | |
|---|---|---|---|
| SUV max ± SD | 16.2 ± 8.6 | 16.6 ± 8.1 | (p>0.05) NS |
| SUV mean ± SD | 9.2 ± 5.1 | 9.7 ± 4.2 | (p>0.05) NS |
| ADC mean ± SD (× 10−3 s/mm2) |
755.5 ± 141.6 | 770.5 ± 132.3 | (p>0.05) NS |
| Group 1 Keratinized Nasopharyngeal Cancer Group 2 Non-Keratinized Nasopharyngeal cancer |
|||
Table 1. Comparison of SUVmax, SUVmean, and ADC mean values between the groups (SD: Standard Deviation, NS: Non-significant). None of the three parameters demonstrated a statistically significant difference between the two groups when SUVmax, SUVmean, and ADCmean values were compared between the groups.
A statistically significant negative correlation was found ADC mean values, and SUV values (SUVmax-mean) (Figures 4 and 5).
Discussion
This is the first study in nasopharyngeal cancer that compared the ADC values in DW-MRI and SUV values of 18F-FDG PET/CT and it demonstrates a statistically significant negative correlation between ADC values and SUV values. DWI is a clinical measurement of the molecular diffusion motion of the water in the extracellular fluid. Since the extracellular water motion would be limited in highly cellular tissues, ADC values decrease. Structural barriers would be decreased in the cystic and necrotic parts of the tumor, and thus the ADC values will be higher. Similarly, the cellularity in the tumor tissue would cause a decrease in water diffusion resulting in a decrease in ADC values.
DWI has the ability to differentiate cystic and benign lesions from malignant ones. In one of the two studies on head and neck cancers, researchers who retrospectively analyzed a total of 33 patients who had 17 benign and 16 malignant lesions found that benign lesions yielded high ADC values and malignant lesions yielded low ADC values. In a similar study, ADC values were suggested to be useful in differentiating benign and malignant head and neck lesions in 78 pediatric patients and this method was emphasized to have an accuracy, sensitivity, and a specificity of 92.8%, 94.4%, and 91.2%, respectively [26,27].
In a different study, ADC values used in diffusion weighted imaging in the differential diagnosis of squamous cancers and lymphoma in head and neck cancers were found to be effective in the differentiation of these two types of cancer. Because tumor cellularity was higher in lymphoma, ADC values were lower under these conditions [28]. Nevertheless, one of the benefits of DWI in head and neck tumors is the ability to evaluate the tumor response to therapy prior to chemotherapy and radiotherapy. In two studies performed in patients diagnosed with squamous cell carcinoma, lower pre-treatment ADC values were obtained in patients in whom a complete response to treatment was obtained and higher in patients who responded partially to the treatment [29,30].
On the other hand, ADC values were reported to demonstrate a negative correlation with histological tumor grade in nasopharyngeal cancers. Low ADC values were demonstrated to be related to an increased tumor cellularity in high grade tumors in some studies; thus it has been reported that ADC might be used as a non-invasive prognostic factor [22]. However, SUV values of 18F-FDG PET/CT and ADC values used in DWI have some similar oncological uses. A positive correlation was found between the SUVmax values of 18F-FDG PET/CT and metabolic volume of the tumor (MTV), tumor stage, and total lesion glucose (TLG) values in nasopharyngeal cancers [31]. Nevertheless, 18F-FDG PET/CT is a method with potential to evaluate the treatment response. A decrease in SUV max values after treatment in 18F-FDG PET/CT has been reported in some studies to be directly proportional with the response of the tumor to the treatment; survival in those patients has also been reported to be longer [32]. ADC values that are used in the diffusion weighted imaging and SUV values that are used in 18F-FDG PET/CT provide indirect information about the cellular density and metabolism of the tumor, respectively. This gives rise to the idea that these two parameters might be correlated in nasopharyngeal cancers. Hence, negative correlations were found between ADC mean and SUV mean, ADC min and SUV max, and ADC min and SUV mean values in a study performed in 29 patients with gastrointestinal tumors [15]. No correlation was found between ADC min and SUV max, and ADC mean and SUV mean values in a study on 33 patients with cervix cancer; however, a negative correlation was found between ADCmin/ADCmean (rADCmin) and SUVmax/SUV mean (rSUVmax) ratios [14].
Negative correlations were found between ADC mean and SUV max (r=-0.619, p<0.001) and ADCmean and SUVmean (r=-0.677, p<0.001) in the present study. The determination of a statistically significant negative correlation between ADC values and SUV values in the present study in patients with nasopharyngeal cancers suggests that MR diffusion imaging may provide a functional imaging similar to PET CT. As reported in many studies on nasopharyngeal cancers, the effective clinical use of PET CT in the evaluation of tumor prognosis and response to treatment suggests that a similar correlation might be provided with ADC values in DW-MRI, as well. A fast scanning period, easy patient preparation, and no use of any intravenous contrast material in MR diffusion imaging puts this method in an advantageous position compared to PET CT, due to the high exposure to radiation in PET CT, use of radioisotopes, high cost of the application, and less availability compared to MR imaging.
However, we encountered some difficulties in diffusion weighted imaging in the present study. In general, the nasopharyngeal region is composed of heterogeneous structures such as fatty tissue, muscle tissue, glandular tissues, bone, and air; and some sensitivity artifacts that may decrease the signal-to-noise ratio might be encountered in the head and neck region such as air, metallic surgical implants, and dental fillings. Furthermore, patient-related motion artifacts such as tooth motions, swallowing, and speaking might also be encountered during the procedure. In this present study, an appropriate diffusion weighted imaging and optimal ADC measurements could not be performed in a substantial number of patients (n: 6). This was a serious limitation of diffusion weighted imaging in nasopharyngeal cancers. Future advances in diffusion MR technology and more studies performed in a higher number of patients with nasopharyngeal cancer will likely demonstrate that diffusion MR imaging is a complementary and alternative method to PET CT.
Conclusion
A negative correlation between ADC values in diffusion weighted imaging and SUV values measured in PET CT in nasopharyngeal cancers suggests that diffusion MR imaging may provide similar functional information with PET CT. We consider that diffusion weighted imaging may be an alternative method to PET CT in the diagnosis and evaluation of treatment response and prediction of prognosis in nasopharyngeal cancers. However, the presence of anatomic and patient-related limitations of diffusion MR imaging in nasopharyngeal cancers are the disadvantages of the method. This problem may be overcome by possible technological advances in the future and we consider that more and extensive studies should be performed on this subject.
References
- Titcomb CP. High incidence of nasopharyngeal carcinoma in Asia. J Insur Med 2001; 33: 235-238.
- Wei WI. Cancer of the nasopharynx: functional surgical salvage. World J Surg 2003; 27: 844-848.
- Tsai MH, Shiau YC, Kao CH, Shen YY, Lin CC. Detection of recurrent nasopharyngeal carcinomas with positron emission tomography using 18-fluoro-2-deoxyglucose in patients with indeterminate magnetic resonance imaging findings after radiotherapy. J Cancer Res Clin Oncol 2002; 128: 279-282.
- Zhang GY, Liu LZ, Wei WH, Deng YM, Li YZ, Liu XW. Radiologic criteria of retropharyngeal lymph node metastasis in nasopharyngeal carcinoma treated with radiation therapy. Radiol 2010; 255: 605-612.
- Lai V, Khong PL. Updates on MR imaging and ¹â¸F-FDG PET/CT imaging in nasopharyngeal carcinoma. Oral Oncol 2014; 50: 539-548.
- Garcia C, Gebhart G, Flamen P. New PET imaging agents in the management of solid cancers. Curr Opin Oncol 2012; 24: 748-755.
- Cook GJ, Wegner EA, Fogelman I. Pitfalls and artifacts in 18FDG PET and PET/CT oncologic imaging. Semin Nucl Med 2004; 34: 122-133.
- Nakamoto Y, Saga T, Fujii S. Positron emission tomography application for gynecologic tumors. Int J Gynecol Cancer 2005; 15: 701-709.
- Ueda S, Kondoh N, Tsuda H, Yamamoto S, Asakawa H, Fukatsu K. Expression of centromere protein F (CENP-F) associated with higher FDG uptake on PET/CT, detected by cDNA microarray, predicts high-risk patients with primary breast cancer. BMC Can 2008; 8: 384.
- Vesselle H, Schmidt RA, Pugsley JM, Li M, Kohlmyer SG, Vallires E. Lung cancer proliferation correlates with [F-18]fluorodeox- yglucose uptake by positron emission tomography. Clin Cancer Res 2000; 6: 3837-3844.
- Schoder H, Noy A, Gonen M, Weng L, Green D, Erdi YE. Intensity of 18 fluorodeoxyglucose uptake in positron emission tomography distinguishes between indolent and aggressive non-Hodg- kin’s lymphoma. J Clin Oncol 2005; 23: 4643-4651.
- Juweid ME, Cheson BD. Role of positron emission tomography in lymphoma. J Clin Oncol 2005; 23: 4577-4580.
- Biehl KJ, Kong FM, Dehdashti F, Jin JY, Mutic S, El Naqa. 18F-FDG PET definition of gross tumor volume for radiotherapy of non-small cell lung cancer: is a single standardized uptake value threshold approach appropriate? J Nucl Med 2006; 47: 1808-1812.
- Ho KC, Lin GG, Wang JJ, Lai CH, Chang CJ, Yen TC. Correlation of apparent diffusion coefficients measured by 3T diffusion-weighted MRI and SUV from FDG PET/CT in primary cervical cancer. Eur J Nucl Med Mol Imaging 2009; 36: 200-208.
- Wong CS, Gong N, Chu YC, Anthony MP, Chan Q. Correlation of measurements from diffusion weighted MR imaging and FDG PET/CT in GIST patients: ADC versus SUV. Eur J Radiol 2012; 81: 2122-2126.
- Sugahara T, Korogi Y, Kochi M, Ikushima I, Shigematu Y. Usefulness of diffusion-weighted MRI with echo-planar technique in the evaluation of cellularity in gliomas. J Magn Reson Imaging 1999; 9: 53-60.
- Schaefer PW, Grant PE, Gonzalez RG. Diffusion-weighted MR imaging of the brain. Radiol 2000; 217: 331-345.
- Matsumoto Y, Kuroda M, Matsuya R, Kato H, Shibuya K. In vitro experimental study of the relationship between the apparent diffusion coefficient and changes in cellularity and cell morphology. Oncol Rep 2009; 22: 641-648.
- Lyng H, Haraldseth O, Rofstad EK. Measurement of cell density and necrotic fraction in human melanoma xenografts by diffusion weighted magnetic resonance imaging. Magn Reson Med 2000; 43: 828-836.
- Fan G, Zang P, Jing F, Wu Z, Guo Q. Usefulness of diffusion/perfusion-weighted MRI in rat gliomas: correlation with histopathology. Acad Radiol 2005; 12: 640-651.
- Chen L, Liu M, Bao J, Xia Y, Zhang J, Zhang L. The correlation between apparent diffusion coefficient and tumor cellularity in patients: A meta- analysis. PLoS One 2013; 8.
- Abdel Razek AA, Kamal E. Nasopharyngeal carcinoma: correlation of apparent diffusion coefficient value with prognostic parameters. Radiol Med 2013; 118: 534-539.
- Chen Y, Liu X, Zheng D, Xu L, Hong L, Xu Y. Diffusion-weighted magnetic resonance imaging for early response assessment of chemoradiotherapy in patients with nasopharyngeal carcinoma. Magn Reson Imaging 2014; 32: 630-637.
- Rosset A, Spadola L, Ratib O. OsiriX: an open-source software for navigating in multidimensional DICOM images. J Digit Imaging 2004; 17: 205-216.
- Gordon AR, Loevner LA, Shukla-Dave A, Redfern RO, Sonners AI. Intraobserver variability in the MR determination of tumor volume in squamous cell carcinoma of the pharynx. AJNR Am J Neuroradiol 2004; 25: 1092-1098.
- Srinivasan A, Dvorak R, Perni K, Rohrer S, Mukherji SK. Differentiation of benign and malignant pathology in the head and neck using 3T apparent diffusion coefficient values: early experience. AJNR Am J Neuroradiol 2008; 29: 40-44.
- Abdel Razek AA, Gaballa G, Elhawarey G, Megahed AS, Hafez M. Characterization of pediatric head and neck masses with diffusion-weighted MR imaging. Eur Radiol 2009; 19: 201-208.
- Maeda M, Kato H, Sakuma H, Maier SE, Takeda K. Usefulness of the apparent diffusion coefficient in line scan diffusion-weighted imaging for distinguishing between squamous cell carcinomas and malignant lymphomas of the head and neck. AJNR Am J Neurora- diol 2005; 26: 1186-1192.
- Kim S, Loevner L, Quon H, Sherman E, Weinstein G, Kilger A. Diffusion- weighted magnetic resonance imaging for predicting and detecting early response to chemoradiation therapy of squamous cell carcinomas of the head and neck. Clin Cancer Res 2009; 15: 986-994.
- Hatakenaka M, Nakamura K, Yabuuchi H, Shioyama Y, Matsuo Y. Pretreatment apparent diffusion coefficient of the primary lesion correlates with local failure in head-and-neck cancer treated with chemoradiotherapy or radiotherapy. Int J Radiat Oncol Biol Phys 2011; 81: 339-345.
- Chan WK, Mak HK, Huang B, Yeung DW, Kwong DL, Khong PL. Nasopharyngeal carcinoma: relationship between 18F-FDG PET-CT maximum standardized uptake value, metabolic tumour volume and total lesion glycolysis and TNM classification. Nucl Med Commun 2010; 31: 206-210.
- Xie P, Yue JB, Fu Z, Feng R, Yu JM. Prognostic value of 18F-FDG PET/CT before and after radiotherapy for locally advanced nasopharyngeal carcinoma. Ann Oncol 2010; 21: 1078-1082.
