Research Article - Biomedical Research (2018) Computational Life Sciences and Smarter Technological Advancement: Edition: II
Automated sub-retinal fluid detection comprising RPE-region using neighbouring pixel connectivity paradigm
Piyush Mishra* and Charul Bhatanagar
Department of CEA-IET, GLA University, 17th Milestone, NH-2, Mathura, Uttar Pradesh, India
Accepted on May 30, 2017
DOI: 10.4066/biomedicalresearch.29-17-689
Visit for more related articles at Biomedical ResearchAbstract
Sub-Retinal Fluid (SRF), a categorized retinal fluid accumulation just above the Inner Hyper-Reflective Layer (HRL) of the RPE-Region has a significant correlation with visual acuity. Sub-Retinal Fluid are the indicators of Macular Hole (MH) formations. Early information regarding SRF may help in tackling the chronic cases, as surgery is the only option for treating MH. Proposed is a method to identify Retinal Pigment Epithelium (RPE) region in Optical Coherence Tomography (OCT) visualization of the retina, further based on it the retinal pathology called as Sub-Retinal Fluid is detected. This paper discusses the newly proposed method for the detection of RPE region, the non-separated region between the inner and outer Hyper-Reflective Layer (HRL). To the best of our knowledge, identification of Sub-Retinal fluid, has never been automated. The work validation is done with the ground truths (manually delineated by an expert panel). Evaluation of the system (RPE-Region detection and SRF Detection) is done independently for both the proposed methods. RPE-region detection was done on 220 images from 23 patients at different orientation styles with 90.45% correct detections whereas the sensitivity and the specificity for the SRF detection is found to be 89.74% and 89.36% respectively over 164 images from 30 patients.
Keywords
Biomedical imaging, Computer aided diagnosis, Optical coherence tomography, Sub-retinal fluid, Retinal pigment epithelium.
Introduction
Retina is the light sensitive, innermost layer of the eye. The eye focuses the image of the world on the retina, starting a series of chemical and electrical events within the retina. Retina then sends the electrical signals to the brain using the nerve fibers present in it. The brain interprets these signals as visual images [1,2]. The human retina has ten distinct layers. Over the years, retinal research has greatly benefited from advances in optical imaging techniques. Fundus imaging is a 2D imaging technique. The image captured by the fundus camera, used to visualize central and peripheral retina, optic disc and macula. Retinal Optical Coherence Tomography (OCT) is a 3D imaging technique. It is a low coherence interferometry to generate cross-sectional imagery of ocular tissues.
Cross-sectional visualization obtained by retinal OCT images are very useful for identification of abnormalities in the retinal layers and in the assessment of their severity. Retinal OCT imaging comprising, Optical Coherence Tomography, images the biological structures based on the light being reflected by the tissues without disturbing their histology and spatial positions. Reflected beam of light from tissues are collected and the delay in time of flight is calculated. This delay information helps to deduce the reflection surface’s longitudinal location, the longitudinal scans known as A-scans. Number of A-scans are performed by the OCT scanner at different lateral positions to get the 2-D map of reflection, known as B-scan [3-13]. More the number of A-scans in a Bscan image, higher will be the image resolution.
Proposed Work
Accurate delineation of retinal layers in the OCT scans is an important step to identify the pathologies inflicting the retina. Delineation of inner Hyper-Reflective Layer (inner HRL) from RPE is difficult because backscattering signals are high in both these layers. Inner HRL is the junction between inner and outer photoreceptor segments while outer HRL is actually the retinal pigment epithelium (RPE) (probably with choriocapillaris). The first part of the work involves accurately identifying these two layers. Under normal conditions, water flows from the vitreous cavity to the choroid. If there is a decrease in the outflow or increase in the inflow of fluid that disturbs the normal compensatory mechanism, fluid starts accumulating between the retinal pigment epithelium and the choroid, known as Sub-Retinal Fluid (SRF). SRF can lead to a sightthreatening disease known as Retinal Detachment. Early detection can save the patient from many complications. The second part of this work involves automatic detection and delineation of SRF. The proposed work uses pixel intensity thresholding and pixel count for the same.
RPE-region detection
Pre-processing: To reduce the noise, the captured scan, first smoothed with non-linear, edge-preserving bilateral filter [14,15]. The weights of the Bilateral Filter depend not only on the Euclidean distance of pixels but also on the pixel color.
 (1)
(1)
Where Wp is normalization factor ensuring pixel weights sum to 1.0.

σs and σr provides filtering parameters for the image I. Gσs is spatial Gaussian weight controlling distant pixels, Gσr is Gaussian range for pixel intensity differences. The smoothened OCT scan, then converted into grey scale (say Igrey). For delineating the RPE interface (RPE Layer and Choroid) in the OCT scanned B-mode images a well-established online freely available software named OCTSEG [16,17] is used. (https://www5.cs.fau.de/our-team/mayer-markus/automated-retinallayer-segmentation/)
RPE Region Detection: OCTSEG delineates the RPE interface by a blue line. The blue plane of this image is subtracted from the grey scale filtered image (Igrey) resulting in an image where the pixels belonging to the RPE layer have higher intensity compared to other pixels. Thresholding applied to get the RPE layer pixels. Empirically, a threshold of 35 separates the RPE layer pixels from other pixels very well. Say this image is IThresh. Applying of equation (3) results in Ir.

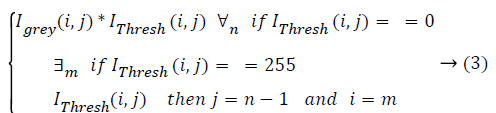
Initial values of i and j are m (number of rows) and n (number of columns) respectively, where m ≥ i ≥ 1 and n ≥ j ≥ 1.
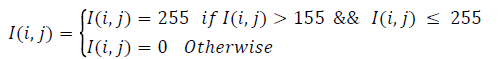
To identify the RPE region, applied thresholding to the resulting image. Empirically, a threshold of 31 segments the retinal area containing the RPE region. Connected components are then extracted from this image. For each component, it’s Area, Centroid, and Perimeter is calculated. Consider the largest connected component. This removes small-scattered spots. The image so obtained (Icc) is then used as a mask to get the actual retinal tissues forming the largest connected component. Icc multiplied with Igrey, resulting Ilcc. To obtain the RPE region, double thresholding is used (Equation 4). This gives most contending pixels for the RPE-Region. To extract RPE-Region completely and separate the other additional pixels, unwanted pixels removed by taking the single largest component [18-20]. Hole filling is applied to get the complete RPE region with no breakages. Consider the image as IR.
 (1)
(1)
Initial values of i and j are m (number of rows) and n (number of columns) respectively, where, also it is repeated for every ‘i’.
To visualize the RPE region in the original image, superimpose the extracted RPE region on the original filtered RGB image. Below shown are some example images demonstrating the performance of the system in detecting the RPE-Region.
Sub-retinal fluid (SRF) detection
To detect the SRF region, start with the binary image Icc obtained while detecting the RPE region. Then apply inverse transformation to the image. Now refer Algorithm-1.
Algorithm-1:
1. r=count row (Icc).
2. c=count column (Icc).
3. for i=1 to i ≤ c
4. for j=1 to i ≤ r
5. if Icc (i,j)==0
6. Icc (i,j)=255
7. break
8. else
9. Icc (i,j)=0
10. end if
11. end for j
12. end for i
13. for i=1 to i ≤ c
14. for j=r to i ≥ 1
15. if Icc (i,j)==0
16. Icc (i,j)=255
17. break
18. else
19. Icc (i,j)=0
20. end if
21. end for j
22. end for i
After this further proceed as Algorithm-2.
Algorithm-2 (Input image I):
1. IH=IR+Icc
2. Perform hole filling operation on IH.
3. IR’=IR.
4. For each pixel of IR, starting column-wise from Top Left of the image, repeat step 5.
5. If IR(i,j)=255 then, go to step 6, else move to next column
6. For IH(i,j) to IH (i-7,j), if IH(i,j)==255, then IR’(i,j)=255. Set this as IT.
7. Now, IF=IT-IR.
8. IFi =Algorithm 3 (IF).
9. Display connected component of IH at location IFi(i,j).
All the image nomenclatures in the SRF-detection Algorithm are similar to that of in the RPE-Region detection.
Algorithm-3 (Input image I):
Step 1 Find connected components of the image I on the basis of “8” connected neighboring pixels.
Step 2 Find the connected component having a maximum area in the image. Let this image be J.
Step 3 Return image J.
Results
SRF detection
The Results are as shown in Table 1.
| Patient (P) No. |
Correct Detections |
Wrong Detections |
Total Detections |
Accuracy |
|---|---|---|---|---|
| 01 | 11 | Nil | 11 | 100.00 |
| 02 | 4 | Nil | 4 | 100.00 |
| 03 | 3 | Nil | 3 | 100.00 |
| 04 | 8 | 1 | 9 | 88.89 |
| 05 | 2 | 1 | 3 | 66.67 |
| 06 | 4 | Nil | 4 | 100.00 |
| 07 | 4 | Nil | 4 | 100.00 |
| 08 | 8 | 1 | 9 | 88.89 |
| 09 | 1 | Nil | 1 | 100.00 |
| 10 | 6 | Nil | 6 | 100.00 |
| 11 | 9 | 2 | 11 | 81.82 |
| 12 | 3 | 1 | 4 | 75.00 |
| 13 | 3 | Nil | 3 | 100.00 |
| 14 | 7 | Nil | 7 | 100.00 |
| 15 | 3 | Nil | 3 | 100.00 |
| 16 | 2 | 1 | 3 | 66.67 |
| 17 | 2 | 1 | 3 | 66.67 |
| 18 | 5 | 2 | 7 | 100.00 |
| 19 | 4 | 1 | 5 | 71.43 |
| 20 | 2 | Nil | 2 | 100.00 |
| 21 | 9 | 2 | 11 | 81.82 |
| 22 | 9 | 2 | 11 | 81.82 |
| 23 | 24 | 1 | 25 | 96.00 |
| 24 | 1 | Nil | 1 | 100.00 |
| 25 | 2 | Nil | 2 | 100.00 |
| 26 | 1 | Nil | 1 | 100.00 |
| 27 | 2 | Nil | 2 | 100.00 |
| 28 | 2 | Nil | 2 | 100.00 |
| 29 | 4 | Nil | 4 | 100.00 |
| 30 | 2 | 1 | 2 | 66.67 |
| Total | 147 | 17 | 164 | 89.63 |
Table 1. Individual results for each patient.
Discussion
Sensitivity=TP/(TP+FN)
= 105/(105+12)
= 105/117
= 89.74 %
Specificity=TN/(TN+FP)
=42/(42+5)
=42/47
=89.36 %
Total number of Patients=27
True Positive (TP)=105, True Negative (TN)=42
False Positive (FP)=5, False Negative (FN)=12
Figures 1 and 2 are example images demonstrating the performance of the system in detecting the RPE-Region and the SRF.

Figure 1: A&C) Bilaterally filtered images given as input to the system for RPE-region detection; B&D) RPE region detected by the system being superimposed with original bilaterally filtered RGB OCT image.

Figure 2: A&C) Bilaterally Filtered images given as input to the system for SRF Detection; B&D) Sub-Retinal Fluid detected by the system being superimposed with original Bilaterally Filtered RGB OCT image.
Conclusion
As mentioned in the previous section (Results) demonstrating via images, the original input images to the system, ground truth images delineated manually by the expert Ophthalmologists, results from proposed method as well as the resultant images from established layer detection software (OCTSEG). In result analysis stage, software (OCTSEG), represented with its overall performance by showing the detection of all the retinal layers done by the software.
The RPE region detected by proposed method is the region in between the non-separated inner and outer HRL, which can be justified to the OCTSEG software detection such that the inbetween region of the two layers i.e. the RPE (in Blue line) and the Outer Nuclear Layer (ONL). The proposed method is novel by detecting the inner HRL of RPE-region (just below the ONL of OCTSEG). It is clear from results that the proposed method is capable of detecting the RPE-region with substantially encouraging results with precise detection of nonseparated inner and outer HRL.
Similarly, for the validation of results in the SRF Detection, medical panel comprising two expert Ophthalmologists, were asked to manually delineate the SRF in the images. Sensitivity and Specificity for the SRF detection are discussed below respectively.
Acknowledgement
The authors would like to thank Dr. Purva Patwari, DNB (Ophthalmology), [Aravind Eye Hospital, Madurai], Vitreo Retinal Surgeon, Retina Centre, Patwari Clinic, Ahmedabad, Dr. Arpan Patel, DOMS, DNB, [Aravind Eye Hospital, Madurai], Nihar Eye Care, Ahmedabad, for agreeing to be on the expert panel and manually delineating boundaries of the desired OCT images. Dr. Markus Mayer, Alumnus of the Pattern Recognition Lab of the Friedrich-Alexander- Universität Erlangen-Nürnberg, Martensstraße, Erlangen, Germany, for sharing information with us regarding his software (OCTSEG). Dr. Nishant Radke [M.S, Retina Fellow (Sankar Netralaya, CHENNAI)], and Dr. T. C. Patre [Former Medical Officer, Raipur] for helpful discussions on Vitreo- Retina. Dr. Charudutt Kalamkar [MBBS, MS, AIIMS-New Delhi] for helping us in gathering the OCT images and preparing the dataset.
References
- Jakobiec FA. Ocular Anatomy, Embryology, and Teratology. Harper & Row Publishers, Inc, Philadelphia, PA, 1982.
- Koozekanani D, Boyer K, Roberts C. Retinal thickness measurements in optical coherence tomography using a markov boundarymodel. IEEE Trans Med Imaging 2001; 20: 900-916.
- Huang D, Swanson EA, Lin CP. Optical coherence tomography. Science 1991; 254: 1178-1181.
- Fernández DC, Salinas HM, Puliafito CA. Automated detection of retinal layer structures on optical coherence tomography images. Optics Express 2005; 13: 10200-10216.
- Hee MR. Artifacts in optical coherence tomography topographic maps. Am J Ophthalmol 2005; 139: 154-155.
- Ishikawa H, Stein DM, Wollstein G. Macular segmentation with optical coherence tomography. Invest Ophthalmol Vis Sci 2005; 46: 2012-2017.
- Kafieh R, Rabbani H, Hajizadeh F. Thickness mapping of eleven retinal layers segmented using the diffusion maps method in normal eyes. J Ophthalmology 2015.
- Huang Y, Cideciyan AV, Papastergiou GI. Relation of optical coherence tomography to microanatomy in normal and rd chickens. Invest Ophthalmol Visual Sci 1998; 39: 2405-2416.
- Montero JA, Ruiz-Moreno JM, Tavolato M. Follow-up of age-related macular degeneration patients treated by photodynamic therapy with optical coherence tomography 3. Graefes Arch Clin Exp Ophthalmol 2003; 241: 775-782.
- Drexler W, Sattmann H, Hermann B. Enhanced visualization of macular pathology with the use of ultrahigh-resolution optical coherence tomography. Arch Ophthalmol 2003; 121: 695-706.
- Jorge R, Costa RA, Quirino LS. Optical coherence tomography findings in patients with late solar retinopathy. Am J Ophthalmol 2004; 137: 1139-1143.
- http://www.academia.edu/16142148/User_Manual_Model_3000_Instrument_and_Stratus_Review_Software
- Costa RA, Calucci D, Skaf M. Optical coherence tomography 3: automatic delineation of the outer neural retinal boundary and its influence on retinal thickness measurements. Invest Ophthalmol Vis Sci 2004; 45: 2399- 2406.
- Tomasi C, Manduchi R. Bilateral filtering for gray and color images. Proceedings of IEEE Sixth International Conference on Computer Vision, Bombay, India, 1998.
- Paris S, Durand F. A fast approximation of the bilateral filter using a signal processing approach. Int J Comput Vis 2009; 81: 24-52.
- Wilkins GR, Houghton OM, Oldenburg AL. Automated segmentation of intraretinal cystoid fluid in optical coherence tomography. IEEE Trans Biomed Eng 2012 ; 59: 1109-1114.
- Mayer MA, Hornegger J, Mardin CY. Retinal layer segmentation on oct-volume scans of normal and glaucomatous eyes. Invest Ophthalmol Vis Sci 2011; 2: 3669.
- Rotsos TG, Moschos MM. Cystoid macular edema. Clin Ophthalmol 2008; 2: 919-930.
- Kempen JH, O’Colmain BJ, Leske SC. The Eye Diseases Prevalence Research Group. The prevalence of diabetic retinopathy among adults in the United States. Arch Ophthalmol 2004; 122: 552-563.
- Pelosini L, Hull CC, Boyce JF. Optical coherence tomography may be used to predict visual acuity in patients with macular edema. Invest Ophthalmol Vis Sci 2011; 52: 2741-2748.