Research Article - Biomedical Research (2018) Artificial Intelligent Techniques for Bio Medical Signal Processing: Edition-II
Automated DR and prediction of various related diseases of retinal fundus images
B. Sumathy1* and S. Poornachandra2
1Department of Instrumentation and Control Engineering, Sri Sai Ram Engineering College, Chennai, Tamil Nadu, India
2Department of Electronics and Instrumentation Engineering, SNS College of Technology, Coimbatore, Tamil Nadu, India
- *Corresponding Author:
- Sumathy B
Department of Instrumentation and Control Engineering
Sri Sai Ram Engineering College, India
Accepted on May 31, 2017
DOI: 10.4066/biomedicalresearch.29-17-480
Visit for more related articles at Biomedical ResearchAbstract
An Automated DR system is developed and prediction of various related diseases are analyzed. Digital Retinal Fundus image is analyzed for the classification of various stages of Diabetic Retinopathy (DR). This imparts much importance, since many of systemic organs disease are related to the developmental stages of DR and those could be predicted well in advance, by analyzing the fundus image itself which is a cost effective technique. This kind of cost effective automated system is needed for mass screening programs in the developing nations. The system is tested on the database obtained from a private hospital in Tamilnadu, which consists of 196 images of different diagnoses. The system outputs are validated with the Expert ophthalmologist’s ground truth images. The proposed method involves three main phases. In the first phase is preprocessing steps are done followed by next phase of removal of normal features with extraction of abnormal features and its statistical values. The third phase is classification stages which includes mild, moderate to severe, severe PDR and neovascularization etc. using neural network. The proposed method has achieved a sensitivity, specificity and accuracy as 94.87%, 90% and 93.22%. The automated detection and classification method surely gives an important and promising data and information to the doctors for further progress in the treatment.
Keywords
Diabetic retinopathy, Abnormal features, Microaneurysms, Exudates, Statistical features, NN architecture.
Introduction
Diabetic retinopathy (DR) arises due to the improper blood sugar control in the body namely diabetes. Diabetes causes problems to the eyes and it is the important factor of blindness all over the world [1]. It is caused when diabetes cause damage to blood vessels of retina [1]. DR is due to the persistent or acute damage of the retina [2-6]. DR is also the ocular manifestations of various systemic diseases. DR is the frequent microvascular complications of diabetes and most cause of blindness and vision loss in the world and actually there are no early symptoms of DR [6]. The DR is classified in to two different types, one as Non-proliferative DR (NPDR) and the other as Proliferative DR (PDR). DR affects the retinal vascular structure and leads as progressive retinal damage [7-17]. The progressive DR causes vision loss and blindness [17]. DR is the leading reason for blindness in the working population in the developing countries [18] and the problem is rising in its number, identified as an important growing worldwide public health problem [19]. In U.K about three million people may be having diabetes in future and in the next 15-30 years [19] and it becomes the third major cause of blindness in India.
The first and foremost sign of DR are the MAs. MAs will be developed because of the dilations of the blood capillaries. It is noticeable as red spots or speck on the retina. Haemorrhages occur when MAs burst [5]. A Haemorrhage is a small micro area of blood which protrudes from artery or vein in the backside of the eye [6]. Yellow coloured lesions namely Hard Exudates (HEs) is occurred due to leakage of fluid from MAs. Another white coloured lesion called soft exudates (SEs) or cotton wool spots (yellow coloured) occur due to the occlusions of the nerve fiber layer [5]. DR is a progressive disease and the last stage is PDR phase. The various lesions associated with DR and normal features are shown in the Figure 1 [9]. The figure shows the retinal image of a diabetic eye with normal anatomical features such as the Optic disk (OD), Blood vessels, Fovea and Macula. Also, the abnormal features such as haemorrhages, Exudates and MAs are present [5]. Larger haemorrhages appear same color as that blood vessels but have the different anatomical structures. With the advancement of disease, growth of new blood vessels or revascularization is triggered and fibrous tissue develops bit by bit in association with new vessels size and is the basis for retinal detachment [7]. New vessels which appear at the optic disk are NVD and new vessels if found anywhere is NVE. New vessels appear as unregulated vessel growth, first appears as loops or Networks on the optic disk or near vein.

Figure 1: Normal and abnormal features of DR image.
Also, in the medical perspective diabetes- DR lead to severe behind problems like vascular issues which gives rise to heart disease, renal problems and cerebrovascular problems [9]. It is chronic life threatening disease and rapidly increasing health threats in India and worldwide [10,14]. The ratio of ophthalmologists in India is insufficient to support the growing diabetic population. India has one ophthalmologist per one lakh patients and this ratio is even smaller for rural setting [12]. The occurrence of diabetes is increasing quickly and more number of patients is having vision threatening DR globally [20,21]. The screening of diabetic patients for the development of DR can potentially reduce the risk of blindness by 50%. For, mass screening programme in developing countries, automated analysis can be done for grading and classifying the abnormalities in the fundus image [22]. An automated method for detection of abnormalities can provide a second opinion to ophthalmologists and particular patient vision loss is prevented or further progression of disease is stopped. The periodic screening of diabetic patients for the development of DR can potentially reduce the risk of blindness by 50% [22]. The automated detection finds more significance, since all diabetic patients exhibit some indications of eye complexities. If the DR could be timely diagnosed and referred to an ophthalmologist, it can prevent 98% vision loss [22].
The paper is segmented as below. Section I portrays Introduction, Section II focusses literature survey of related works in automated DR, In Section III, proposed method is explained followed by Results and Discussion in Section IV. In Section V feature extraction part is well described and Retinal fundus images are classified as Normal and Abnormal. In Section VI Conclusion and future enhancements are discussed.
Literature Survey
Maher et al. [1], presented an automated system to analyze the retinal abnormal features. Better preprocessing techniques was utilized to attenuate the noise to improve the contrast and mean intensity. Hard exudates were detected and segmented from database images. Also, dark lesion detection methods were proposed by utilizing polynomial contrast enhancement. SVM based supervised learning tool were applied for data classification based on regression. In a study by Somfai et al. [3] presented and evaluated a non-linear prediction method for early detection of DR on OCT images. Shruthi et al. [4] developed an automated system to identify early signs of DR. Retinal features were detected and extracted using Top-Hat and Bottom-Hat operations and K-means clustering technique. Statistical parameters were calculated and K-NN classifier was used to identify healthy and unhealthy retinal images. Welikala et al. [7] described an automated method for detection of new vessels in the retinal images due to DR. Two vessel segmentation approaches were applied by using standard line operator and a novel modified line operator. Both operators were processed and features were measured from each binary vessel map to produce two separate feature sets. SVM were used for independent classification of each feature set and the combination of individual classification was used for final decision.
In different studies an automated analysis and detection of exudates due to DR was developed [8]. Both Fuzzy Logic and NN tool were utilized to identify the abnormalities in the foveal region. The BPN algorithm was used to minimize the objective function which was a multi-stage dynamic system optimization method. Kaur et al. [10] developed an automated system for normal and abnormal features from retinal fundus images for DR. Filter based approach was applied to segment the vessels and were tuned to match the vessels extracted and non-vessels based on thresholding method. In another study, anatomical structures such as blood vessels, exudates and MAs were segmented [11]. Based on the segmented features, the gray level co-occurrence features were used to classify DR images. The classifier utilized was the SVM classifier. Kumar et al. [12] developed an automated system for MAs detection in non-dilated RGB Fundus images. Early symptoms of DR were aimed to be detected to reduce the incidence of blindness. The proposed method followed fundamental steps as preprocessing, feature extraction based on texture feature and the last to classify the severity of DR. Sopharak et al. presented an automated exudates detection using optimally adjusted morphological operators even for low contrast images [14]. The proposed system, work effectively even on a poor computing system.
Proposed Method
The proposed method is organized as three main phases. The first step is preprocessing followed by proper Image enhancement techniques. The next is removal of healthy features like optic disc and blood vessels followed by detection and segmentation of, features namely exudates Microaneurysms, cotton wool spots and neovascularization stage. The third phase is the classification stage of DR namely mild stage, moderate to severe stage and very severe stage using Bayesian Neural Network training algorithm.
Database
The proposed method is tested and evaluated on the database, received from the Rajiv Gandhi Eye hospital from Trichy, Tamilnadu. The Database has 196 images with a variety of diagnoses captured by a Topcon TRV-50 fundus camera at 45 degree FOV. Clinical Validation is done by an expert Ophthalmologist from the same hospital. The flow diagram of the proposed method is shown in Figure 2.

Figure 2: Flow diagram for automatic detection and classification.
Preprocessing of fundus image
Image preprocessing is the initial step in Automated DR diagnosis. It includes resizing of the retinal fundus image, followed by contrast enhancement, and followed by denoising. Input image is a RGB image and any one channel can be used and hence it is separated. The channel which has got a good contrast than the other two i.e. green/gray is used. Better contrast is achieved with the background images for detection. Hence, green channel is considered as natural basis for automated detection algorithms. The preprocessing step is involved in order to avoid or reduce non-uniform illumination while capturing of fundus images, removal of noise present and makes the image suitable for automated detection.
Preprocessing Steps.
Algorithm 1:
Step 1: Get the Input Image as RGB fundus image
Step 2: Resize the RGB Image
Step 3: Extract the green Channel
Step 4: Apply suitable threshold to convert to binary
Step 5: Filter/ Denoise using the sobel filter
1) RGB to green channel: The RGB image is reshaped for the standard size. Then, green channel part is extracted by appropriate method. The contrast should be the main criteria at this stage. The abnormal appear with the high contrast in green channel. The intensity value represents height above the base plane and therefore image represents a surface in three dimensional Euclidean space.
2) Sobel filter: Image denoising or filtering is used to remove the added noise in the fundus image. The sobel filter is very robust and has the capability to filter noise by preserving its edge. Sobel operators perform a 2-D spatial gradient measurement on retinal image and emphasize regions of high spatial frequency corresponding to edges. It has a pair of 3 × 3 convolution kernels. One kernel is in 0 position and other rotated by 90 degree. Each orientation kernel gradient is measured as gradient magnitude. The gradient image is
 (1)
(1)
The angle of orientation of the edge gives rise to spatial gradient and the operator amplifies high frequency.
Segmentation of normal and abnormal features
1) Removal of optic disk: As the optical disk is made up of a group of bright spots, it is not suitable to use loops for finding the largest value. So, the circular border is removed and exudates are separated. The Optic disk and exudates show high intensity values compared with the other features. Almost, both possess similar characteristics. Optic disk is characterized by the largest area, high contrast, circular shape areas. Column matrix of vessel removed image is used as input image and is further processed. Column maximum value is found by an acceptable procedure by which equivalence median value is found. The highest row and column value of optic disk is calculated by a suitable matlab procedures. A mask is created with a radius of 90 degree by the subsequent equation of the circle (2).
 (2)
(2)
R-radius, b is the offset, a, b gives the maximum row and column value. This value should coincide with the size of Optic disk.
2) Vessel detection and elimination: The blood vessel network in the fundus image is to be removed, which is one of the important healthy features in the retina. The vessels are detected and eliminated using morphological operator, namely the closing operator. Closing is dilation followed by erosion. Closing is mathematically represented as follows.
Closing operation: The closing of A by B is done by the dilation of A by B and tracked by erosion of the resulting structure by B.
A - Input Image, B - Structuring Element
Dilation process is used to expand the size of exudates, which is the region of interest. Erosion process done to remove the other structures which lesser than the size of the structuring element. Dilation can be represented by (4) and it expands the image. Erosion can be represented by (5) and it shrinks the image.
 (4)
(4)
 (5)
(5)
Step 1: Shade corrected optic disk removed image is closed using the ball Shaped structuring element of size 8.
Step 2: Shade corrected image is filled to remove all the Holes in the vessel.
Step 3: Filled image is subtracted from closed image to get the segmented vessels.
Step 4: Suitable threshold is applied to remove the segmented vessels.
3) Segmentation of abnormal structures: The resulting image is been removed with all the healthy or anatomical like macula, optic disk and blood vessel network and has the presence of only abnormal features used to automate the DR detection. The various abnormal features are Microaneurysms, Exudates, Haemorrhages and neovascularization etc. MAs are isolated patterns and are disconnected from the vessels. The features of MAs can be extracted based on shape, size etc. Each object’s area and perimeter is calculated used to find the roundness of the object.
 (6)
(6)
Objects which have area greater than 11 pixels and roundness metric less than 0.95 are removed which is not MA. Next, closely distributed cluster of exudates is to be detected. The resulting image from the previous steps, with removed blood vessels and Optic disk are taken. The image is thresholded and noise is removed. Then, Haemorrhages which are the leakage from Microaneurysms and exudates if harder and more crowded like structure become cotton wool spots are detected from the resulting image. Thus, the segmented abnormal structures of retinal images are allowed for further analysis.
Texture analysis
Texture analysis gives information about the arrangement of surface pixels with surrounding pixels [11]. Statistical texture analysis is done based on Gray Level Co-occurrence Matrix (GLCM). The major statistical method used in texture analysis is based on definition of the joint probability distributions of pair of pixels. The second-order histogram is defined as the cooccurrence matrix hdθ (i, j) [23]. In order to find the joint probability pdθ (i, j), for two pixels, divide the total number of neighbouring pixels R (d, θ) in the image, from hdθ (i, j), where a is the distance, d is separation, θ is direction for various co-occuring values of i, j. Two kinds of co-occurrence matrix can be found one as symmetric and other as nonsymmetric. Symmetric matrix pairs are separated by d and -d (θ-direction) and non-symmetric as by using separation d. For the given image f(x, y), the matrix hdθ (i,j) can be equated for (i,j)th entry to matrix values existing for number of times, where G is the set of discrete intensity levels of the image.
where  (8)
(8)
The result is square matrix giving number of intensity levels, for all (d=1, 2 pixels) and (θ=0°, 45°, 90° and 135°). Pixel pairs with high correlation rate makes entries in hdθ (i,j) to cluster in the diagonal side. Co-occurrence matrix calculation is illustrated in Figure 3, for d=1. Small value of d are required for the fine texture classification and large value gives coarse textures. Computational speed can be increased by the reduction in number of intensity levels, with some loss of repeated textural information. The co-occurrence matrix contains G2 elements are more for texture analysis in a reasonable time. So, a reduced number of features can be calculated and utilized for texture separation.

Figure 3: Spatial co-occurrence calculations.
Feature extraction
Feature extraction is a special dimensionality reduction step, in which feature contributing to diagnose DR well in advance are extracted. Also, the feature extraction simplifies the amount of resources used to describe the large data set accurately. Textural features characterize the textural properties of the images such as spatial structure, contrast, roughness, orientation etc have correlation with the desired output. Also, from the input data, required reduced set of features are found [24], which will extract the relevant information to find the abnormality in fundus images. The second order statistical values are considered which accounts for the spatial interdependency or co-occurrence of two pixels at specific relative positions. Therefore, Co-occurrence matrix based features are extracted from the segmented image. Some of features are defined by the equations that are given below, where μi, μj and σi, σj denote the mean and standard deviations of the row and column sums of the matrix, respectively, related to the marginal distributions px(i) and py(j). The extracted features are tabulated.
Contrast: Contrast gives the changes in localized surrounding of an image. It gives the sensitivity of texture features that change in intensity. That is it gives the intensity contrast between the test pixel with neighborhood pixel. For constant image the contrast is zero, texture is acute and for high local variation, contrast value is more. This is true for more gray scale difference, whose texture is coarse and with large contrast. Pij are elements of GLCM.
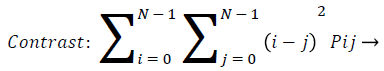 (9)
(9)
Correlation: Correlation calculates the linear dependency of the gray level values in the co-occurrence matrix. This is uncorrelated to energy, contrast and homogeneity.
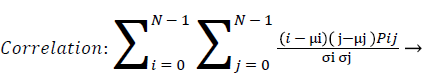 (10)
(10)
Homogeneity: Homogeneity measures the similarity of pixels. It measures the closeness of the distribution of the elements in the GLCM to the GLCM diagonal. A diagonal GLCM gives homogeneity of 1 and it becomes large if local textures only have minimal changes. Homogeneity is also called inverse difference.
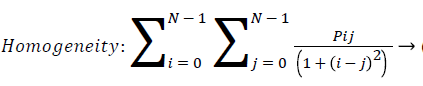 (11)
(11)
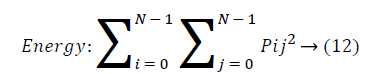
Energy: Energy is the sum of squared elements in cooccurrence matrix. Energy is also called as uniformity or angular second moment(ASM). For more homogeneous image, energy value is large and constant image energy value equals to 1.
Entropy: Entropy is a measure of randomness of intensity image and takes low values for smooth images.
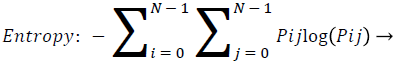 (13)
(13)
Disease classification using neural network
Neural network training tool with feed forward neural network is used for training and testing. The net has one-way connections from input to output layers and used for prediction and non-linear function fitting. The network is a two layered feed forward network with one sigmoidal hidden neuron and one linear hidden neuron and one linear output neuron. Bayesian regularization back propagation neural network algorithm is used and weight and bias updation values are done according to Levenberg-Marquardt optimization (Figure 4).

Figure 4: Neural network model structure.
This LM optimization minimizes a combination of squared errors and weight and then determines the correct combination so as to find various stages of Diabetic retinopathy using Bayesian Regularized Artificial Neural Networks (BRANNs). BRANN is more robust than standard nets and can reduce the need for lengthy cross validation. Also, the regularization make the network response smoother through the modification in the objective function by a penalty term consists of squares of all net weights. BRANN automatically sets the optimal performance function to achieve the best generalization based on Bayesian interference.
BR introduces network weights into training objective function is denoted as F(ω).
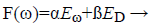 (14)
(14)
Eω-sum of squared network weights
ED-sum of network errors
α,ß-Objective function parameters
The weights of network are viewed as random variables and distribution of networks and training set are considered as Gaussian distribution. α, are defined using Bayesian’s theorems. To find the optimal weight space, objective function needs to be minimized.
Methodology of Testing and Analysis
Training
137/196 fundus retinal images of various category of Diabetic Retinopathy are considered for the training phase. The various categories are mild stage, moderate to severe, Remild stage Vitreous Haemorrhage, RE stable PDR, very severe stage.
Testing
59/196 fundus retinal images are considered for testing and its statistical parameters are analyzed using BRNN. The testing phase verifies the different stages of DR.
Analysis
The stages of DR prediction are done using BRANN. This process uses NN tool case in MATLAB software to train, verify and test the net. The statistical data is fed as excel for the input data processing. The ANN information is shown in Table 1. The ANN modelling is shown in Table 2.
| S.No | ANN information | Database |
|---|---|---|
| 1. | Number of data for analysis | 5 |
| 2. | Number of input Images for Training | 196 |
| 3. | Number of Images for Testing | 117 |
| 4. | Input Images | 196 |
| 5. | Output | DR stage |
Table 1. ANN information.
| Training Algorithm | Function | Training | Testing | Network Architecture |
|---|---|---|---|---|
| Bayesian Regularized BPN | LOGSIG | 137 | 59 | 5-2-1 |
Table 2. ANN modelling.
Training algorithm
BPN is used for network training and it is based on supervised learning technique. The input-output pairs are used to train a network until the network approximate a function. LOGSIG and LINEAR function are used for the end results. The Bayesian Regularization takes place within the Levenberg- Marquardt algorithm. The Performance parameter is the Sum of Squared error (SSE) and the Data division is Random. BPN is used to calculate the Jacobian jX of performance with respect to the weight and bias variables X. Each variable is adjusted according to Levenberg-Marquardt,
jj=jX*jX
je=jX*E
dX=-(jj+I*mu)/je → (15)
Where E - all errors, I - identity matrix.
The adaptive value mu is increased by mu_inc until the change shown above results in a reduced performance value. Each change in value updated in the network, and mu is decreased by mu_dec. The Training can be stopped when any of these conditions occurs.1. The maximum number of epochs (repetitions) is reached, 2. The maximum training time limit is passed, 3. Goal with minimum Performance value, 4. The performance gradient reduces below min_grad, and 5.mu has exceeded the mu_max value [25]. The training parameters are shown in Table 3.
| Training Parameters | Values |
|---|---|
| Number of epochs | 1000 (maximum epochs) |
| Performance goal | 0 (Good) |
| Gradient | 1 (optimum) |
| Marquardt adjustment parameter | 0.005 |
| Decrease factor for mu | 0.1 (mu_dec) |
| Increase factor for mu | 10 (mu_inc) |
| Maximum value for mu | 1e10 (mu) |
| Maximum validation failures | 6 (θ) |
| Validation stops | Default (max_fail=0) |
Table 3. Training parameters.
Validation stops are disabled by default (max_fail=0). The training will continue till suitable value of errors and weight values are ended.
Results and Discussion
Implementation
The proposed is tested and evaluated on the database collected from the Mahatma Eye Hospital and Research Centre, Trichy, and Tamilnadu. The database provides 196 images with variety of diagnoses of Diabetic Retinopathy with Jpeg format. The images are captured by a fundus camera TOPCON-TRC-50 at 45 degree FOV. In the proposed method five second order statistical features namely contrast, correlation, homogeneity, energy and entropy have used as inputs to neural network classifier for classification. 196 images are analyzed were resized to the standard size 252 × 252, utilized for experimental evaluation. From the result of the test data, the accuracy of the classifier is discussed.
The MLFFNN is a multilayer feed-forward Back propagation neural network is used. Supervised learning is done by providing the ANN with input data and matches them with output results. The weights in each layer are adjusted according to the training rules before undergoing for testing.
The input layer has five data (neurons) and process the activation function. There are ten neuron for each hidden layer and trained network output has five output stages. The input is propagated forward through the network to compute the output vector. The output vector is compared with the desired output and the errors are determined. The process is repeated until the errors being minimized. Training algorithms for feed forward networks can be updated by using the gradient of the performance function to determine weight adjustment factor for minimizing performance. The weight vectors are randomly initialized to trigger the training process. During training, the weights of the network are adjusted according to the iteration value to minimize the network performance function as sum of squared error.
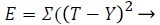 (16)
(16)
Where T is target and Y is output
Training and testing data set
The data is being fed into the NN tool for training. The goal of the training is 0.001 and maximum allowable error is less than 0.1%. Number of epochs are 400. 70% of data was used as training data and 30% as test data. The training process involved with neural network models having 10 neurons in hidden layer. The total 196 images are divided as 70% of training data of 137 images and 30% of testing data of 59 images.
Output results and discussion
The proposed method is tested and evaluated on the selected images received from the collected database. The database has retinal fundus images of various diagnoses of DR. Depends upon the output values, classification of DR is made.
Simulation results and discussion
The data from mat file is fed into the ANN for training. The goal of the training is 0.001 means the allowed error is targeted to be less than 0.1%. No. of Epochs is as 400. The input-output pairs are used to train a network until the network approximate a function. LOGSIG and LINEAR function are used for the end results. The adaptive value mu is increased by mu_inc till the above result gives decrease in performance value. Each change in value updated in the network, and mu is decreased by mu_dec.
The Training can be stopped when any of these conditions occurs. 1. The maximum number of epochs (repetitions) is reached, 2. The maximum time limit is passed, 3. Performance went below the goal value, 4. The performance gradient reduces below min_grad, and 5. mu has exceeded the mu_max value [25]. Validation stops are disabled by default (max_fail=0) so that training can continue until an optimal combination of errors and weights is found.
Performance measures (accuracy assessment)
The accuracy of the classification is done using sensitivity, specificity, positive prediction value (PPV), negative prediction value (NPV) as given by equations (17-21) based on the four possible outcomes - true positive (TP), false positive (FP), true negative (TN) and false negative (FN). The sensitivity measures the proportion of actual positive stage of DR that is correctly identified. On the other hand, specificity measures the proportion of negative stage recognized correctly. The higher the sensitivity and specificity values, the better the diagnosis.
Sensitivity=TP/(TP + FN) → (17)
Specificity=TN/(FP + TN) → (18)
PPV=TP/(TP + FP) → (19)
NPV=TN/(TN + FN) → (20)
Accuracy=(TP + TN)/(TP + FN + TN + FP) → (21)
Also TP is the number of abnormal fundus images found as abnormal, TN is the number of normal fundus images found as normal [25], FP is the number of normal fundus images which is found as abnormal (false positives) and FN is the number of abnormal fundus images found as normal (false negatives).
The performance analysis revealed that TP=37, FP=2, TN=18, FN=2, sensitivity=94.87%, specificity=90%, positive predicted value (PPV)=0.949, and negative predicted value (NPV)=0.9. The overall classification accuracy is 93.22%. This can be shown in the Table 4.
| Classifier | BPNN |
|---|---|
| No. of training Images | 137 |
| No. of test images | 59 |
| TP | 37 |
| TN | 18 |
| FP | 2 |
| FN | 2 |
| Sensitivity | 94.87% |
| Specificity | 90% |
| Accuracy | 93.22% |
| PPV | 0.949 |
| NPV | 0.9 |
Table 4. Performance evaluation of the classifier.
Conclusion and Future Works
An automated DR detection and prediction of various related diseases has been successfully developed. The proposed method is able to detect all the abnormal features in the fundus images with the performance approaching that of trained clinical observers. The system proposed a novel combination of image preprocessing technique for retinal anatomical structures and classification with machine learning. The system is a computer based which extracts abnormal features such as microaneurysms, exudates, haemorrhages and new vessels etc. for grading the severity of Diabetic Retinopathy. Early detection, diagnosis and analysis of DR gains importance since it enable timely treatment and vision loss. The proposed method reported a sensitivity of 94.87%, specificity as 90%, and accuracy of 93.22% which are comparable and best with the existing methods. Also, this method is found to reduce the manual effort required for the detection and also the accuracy gets increased. The proposed algorithms are computationally powerful to detect and diagnose the diseases from the fundus images. The limitation is the non-detection of the soft exudates that occurred in the optic disk - because of its removal.
Future enhancement can be concentrated to diagnose the soft exudates which are present in the optic disk also. Future works also include the application of the proposed method to other imaging modalities and larger data sets. Another stronger algorithm can be developed for neovascularization especially after photocoagulation therapy. More advanced wok may include the use of the proposed method to predict the systemic organ diseases. This may be achieved through fundus imaging for Diabetic retinopathy and help the human environment with low cost imaging for prediction of systemic organ diseases.
References
- Maher RS, Dhopeshwarkar M. Automatic Detection of Microaneurysms in Digital Fundus Images using LRE. J Comput Eng 2016; 18: 11-17.
- Walvekar M, Salunke G. Detection of Diabetic Retinopathy with Feature Extraction using Image Processing. Int J Emerg Technol Adv Eng 2015.
- Somfai GM, Tatrai E, Laurik L, Varga B, Olvedy V, Jiang H, Wang J, Smiddy WE, Somogyi A, Debuc DC. Automated Classifiers for early detection and Diagnosis of Retinopathy in Diabetic Eyes. BMC Bioinformatics 2014; 15: 106.
- Shruthi CH, Ramakrishnan N, Krishnan MM. Detection and Classification of Diabetic Retinopathy condition in Retinal Images. Int J Innovat Res Elect Commun 2014; 1: 31-40.
- Abràmoff MD, Garvin MK, Sonka M. Retinal imaging and image analysis. IEEE Rev Biomed Eng 2010; 3: 169-208.
- Shingade AP, Kasetwar AR. A Review on Implementation of Algorithms for detection of Diabetic Retinopathy. Int J Res Eng Technol 2014.
- Welikala RA, Dehmeshki J, Hoppe A, Tah V, Mann S. Automated Detection of Proliferative Diabetic Retinopathy using a Modified Line operator and Dual Classification. Comput Methods Programs Biomed 2014; 14: 247-261.
- Vandarkuzhali T, Ravichandran CS, Preethi D. Detection of Exudates Caused by Diabetic Retinopathy in Fundus Retinal Image using Fuzzy K-means and Neural Network. J Elect Electron Eng 2013; 6: 22-27.
- Faust O, Archarya R. Ng YK. Algorithms for the Automated Detection of Diabetic Retinopathy using Digital Fundus Images- A Review. J Med Syst 2012; 36: 145-157.
- Kaur J, Sinha HP. Automated Detection of Diabetic Retinopathy using Fundus Image Analysis. Int J Comput Sci Informat Technol 2012; 3: 4794-4799.
- Selavathi D, Prakash NB, Balagopal N. Automated Detection of Diabetic Retinopathy for Early Diagnosis using Feature Extraction and Support Vector Machine. Int J Emerg Technol Adv Eng 2012.
- Kumar SB, Singh V. Automatic Detection of Diabetic Retinopathy in Non-dilated RGB Retinal Fundus Images. Int J Comput Appl 2012.
- Agurto C, Barriga ES, Crammer R, Bauman W, Zamora G, Pattchis MS, Soliz P. Automatic Detection of Diabetic Retinopathy and Age- Related Macular Degeneration in Digital Fundus Images. Invest Ophthalmol Visual Sci 2011; 52: 5862-5870.
- Sopharak A, Uyyanonvara B, Barman S, Williamson TH. Automatic Detection of Diabetic Retinopathy Exudates from Non-dilated Retinal Images using Mathematical morphology Methods. Comput Med Imaging Graphics 2008; 32: 720-727.
- Bouhaimed M, Gibbins R, Owens D. Automated Detection of Diabetic Retinopathy Results of a Screening Study. Diabet Technol Ther 2008.
- Abramoff MD, Niemeijer M, Suttorp- Suhulten MSA, Viergever MA, Russell SRR, Ginneken BV. Evaluation of a System for Automatic Detection of Diabetic Retinopathy from Color Fundus Photographs in a large Population of Patients with Diabetes. Diabetes Care 2008.
- Klein R, Klein B, Moss S, Davis M, DeMets D. The Wisconsin Epidemiologic Study of Diabetic Retinopathy. Prevalence and Risk of Diabetic Retinopathy when Age at Diagnosis is Less Than 30 Years. Arch Ophthalmol 1984; 102: 520-526.
- Maher R, Kayte S, Panchal D, Sathe P, Meldhe S. A Decision Support System for Automatic Screening of Non-proliferative Diabetic Retinopathy. Int J Emerg Res Manage Technol 2015.
- Osareh A. A Computational Intelligence-Based Approach for Detection of Exudates in Diabetic Retinopathy Images. IEEE Trans Informat Technol Biomed 2009; 13: 535-545.
- Klein R, Klein BE, Moss SE. How many steps of progression of Diabetic retinopathy are meaningful? The Wisconsin epidemiologic study of Diabetic retinopathy. Arch Ophthalmol 2001; 119: 547-553.
- Sumathy B, Poornachandra S. Exudates Detection- A Potential Marker for Diabetic Retinopathy and its Complications. Int J Appl Eng Res 2015.
- Haralick RM. Statistical and Structural approaches to Texture. IEEE 1979.
- Adalarasan R, Malathi R. Automatic Detection of Blood Vessels in Digital Retinal Images using Soft Computing Techniques. Int Confer Process Material Mineral Energy 2016.
- http://in.mathworks.com/help/nnet/ug/multilayer-neural-network-architecture.html?requestedDomain=in.mathworks.com
- Sheshadri HS, Manojkumar SB. A Survey on: Evaluation database for DR. Second National conference on Emerging Trends in Electronics and Communication, NCETEC-15, ISRASE 2015.