Research Article - Biomedical Research (2016) Computational Life Sciences and Smarter Technological Advancement
An enhanced ultrasound kidney image classification for health care
R Vinoth1, K Bommannaraja2*1Department of Electronics and Communication Engineering, Mahendra Engineering College, Tamil Nadu, India
2Department of Electronics and Communication Engineering, KPR Institute of Engineering and Technology, Tamil,Nadu, India
- *Corresponding Author:
- K Bommannaraja
Department of Electronics and Communication Engineering KPR Institute of Engineering and Technology India
Accepted on April 14, 2016
Abstract
An enhanced medical decision support system for classification of Ultrasound Kidney images is developed for health care and presented in this paper. The image enhancement was done by removing the speckle, salt and pepper noises using fuzzy c means filtering and the Gray Level Coocurrence Matrix was obtained for feature extraction. Gabor wavelets and Histogram equalization were used for the selection of texture features. The classification is done using SVM, ANN, K-NN and Hybrid classifiers and the accuracy of classification was found to be 99.6% for the SVM- ANN hybrid classifier. The developed system is expected to provide support for the medical practitioners for decision making to provide an enhanced health care.
Keywords
Gray level coocurrence matrix, SVM classifier, ANN Classifier, KNN Classifier, Ultrasound kidney image, Health care.
Introduction
In the past few decades, medical imaging and associated systems are found to play vital role in developing an accurate computer assisted Medical Decision Support System for the clinical practitioners for better health care. The development in the soft computing techniques further motivated the research to use them for developing more decision support systems. It has been witnessed that the Ultrasound (US) image of kidney is preferred by most of the physicians for diagnosis of kidney. It was also reported that identification of the kidney disease from the US image is considered to be the challenging task due to inherent limitations. With the development in the image processing tools, the classification of US kidney has become accurate and preferred.
Many researchers have reported various techniques to overcome these limitations and provided variety of solutions for classification of abnormalities in the kidneys. Leavline and Singh [1] reported the impulse noise removal using the standard median filtering technique and its variants were analyzed. Simulations were carried out on a set of standard gray scale images and the state of the art median filter variants were compared in terms of the well known image quality assessment metrics namely Mean Square Error (MSE) and Peak Signal to Noise Ratio (PSNR). Kenny and Nor [2] also proposed a novel method for the removal of noise from images. The Cluster based Adaptive Fuzzy Switching Median (CAFSM) filter was found to have the capability in handling realistic impulse noise model for real world applications and easy to implement the filtering phase replaces the detected noise pixels in the image.
Shruthi et al. [3] proposed a despeckling filter scheme based on Gabor wavelet in order to enhance the quality of image by reducing the speckle noises. It was showed that higher the PSNR values lower the MSE value which indicates that more noise is removed. Joseph et al. [4] also proposed a new weighted linear filtering approach using Local Binary Patterns (LBP) for reducing the speckle noise in ultrasound images. It was reported that improved results can be achieved by reducing the noise without affecting the image content. It was found that the developed weighted linear filter performs better then filters in terms of quantitative analysis and edge preservation. Onder and Karacali [5] developed to perform the automated texture classification of histology slides using grayscale images and manifold learning method.
Texture feature vectors were obtained using local gray scale co-occurrence matrices and the dimension of the feature vector space was lowered using Isomap dimension reduction. In a lower dimension feature space, k-means clustering operation was performed in order to provide separate texture clusters. Raja et al. [6] reported the classification of US kidney images using dominant Gabor wavelet. The Gabor wavelet was determined by maximizing the similarity between original preprocessed image and reconstructed Gabor image. It was observed that, the dominant Gabor wavelet improves the classification efficiency appreciably. The possibility of implementing a computer aided diagnosis system exclusively for US kidney images were explored.
Extraction of texture from the image using Gray Level Coocurrence Matrix approach has been done by many researchers and proven to be the best. Mohanaiah et al. [7] developed a method of capturing visual content of images for indexing and retrieval. Primitive or low level image features can be either general features, such as extraction of color, texture and shape or domain specific features. Application of gray level co-occurrence matrix (GLCM) to extract second order statistical texture features for motion estimation of images was presented. The feature extraction, feature selection and discretization process to reduce the mining complexity was reported by Jicksy et al. [8]. The association rules were generated based on the selected features then the Bayesian Classifier was found to have high accuracy. Gray Level Co- Occurrence Matrix (GLCM) features were extracted from segmented images to classify the images and reported by Prema Akkasaligar and Sunanda Biradar [9]. The K-Nearest Neighbor (K-NN) classifier was used to classify the images as normal and cystic kidney images. The GLCM extracted features were found highly significant in classification of kidney images as normal and cystic.
Center Symmetric Local Binary Pattern Gray Level Cooccurrence Matrix method for the purpose of extracting second order statistical texture features in ultrasound kidney images was proposed by Christiyana and Rajamani [10], an increase in retrieval efficiency, accuracy and reduction in time complexity of ultrasound kidney images retrieval system were experimented. Xie et al. [11] reported a novel texture and shape priors based method for kidney segmentation in US images. Texture features were extracted by applying a bank of Gabor filters on test images through a two-sided convolution strategy. Here the parameters of the shape model were calculated to minimize a novel energy function was implemented. The effectiveness of this method was demonstrated by experimental results on both natural images and US data compared with other image segmentation methods and manual segmentation. Segmentation focused on the process of splitting or partitioning an image into pixels to find the meaningful regions for the comparison of texture parameters. Tamilselvi and Thangaraj [12] proposed a Segmentation of calculi from US kidney images by region indicator with contour segmentation method. The segmentation was done to identify the region of interest of the image to analyze or extract the texture features of that required area.
The performance analysis of kidney stone detection from US image by level set segmentation and Artificial Neural Network classification was developed by Viswanath and Gunasundari [13]. Here the energy level gives an indication about the presence of stone in that particular location. The energy levels were trained by Multilayer Perceptron (MLP) and Back Propagation (BP) ANN to identify the type of stone with good accuracy. CAD system was developed for automatic classification of US kidney images using a set of statistical and multi-scale wavelet based features by Mariam et al. [14].
Principal component analysis was performed to reduce the number of features to utilize in the design and training of a Neural Network classifier. The classification rate of 97% was reported. Thai et al. [15] proposed the image classification using SVM and ANN. It was combined together and applied for the roman numerals to get the accuracy rate of 86%.
An Enhanced system for classification of brain tumor from MRI images in association of kernels with SVM was developed by Madheswaran and Dhas [16]. ORNRAD filter was used for denoising the image and texture features were extracted using GSDM and tamura method. The accuracy of classification was achieved to be 98.63%. Zhang et al. [17] also developed to achieve a classification rate of 59.05% on the combination of SVM and KNN. The number of benchmark data sets for shape and texture classification was experimented. It is clear from the literatures that many feature extraction techniques and classification algorithms were tried by many researchers for improving the classification accuracy. Keeping this in view, the medical decision support system was developed using SVM, ANN, KNN and hybrid classifier was reported.
Materials and Methods
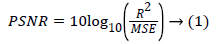
The flow graph of the developed medical decision support system for classification of kidney images is shown in Figure 1. The US kidney images are acquired and preprocessed to improve the image quality. The speckle, salt and pepper noise can be removed using Fuzzy c means filtering. The textures features are extracted by Gray Level Coocurrence Matrix and the features are optimized using the Gabor wavelet transform. The decision support system are trained with optimal features and used as a image database. The distance vector classifiers can be used to classify the images based on patterns located and compares the input image with query image to produce the true positive and false negative samples. Image classification can be done using support vector machine, artificial neural network, k-nearest neighbour and the combination as hybrid classifier to classify the image as normal or abnormal. The two metrics namely Mean Square Error (MSE) and Peak Signal to Noise Ratio (PSNR) can be used to find the image quality and the performance of the filters. The MSE represents the cumulative squared error between the original image and the output image, whereas Peak Signal to Noise Ratio (PSNR) represents a measure of the peak error. The lower the value of MSE, the lower is the error. The PSNR can be calculated using

Figure 1: Flow graph of the medical decision support system.
Where,
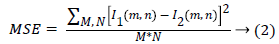
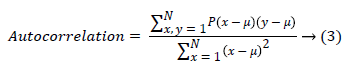
Here, M and N are the number of rows and columns in the original image, and R is the maximum fluctuation in the input image data type. Texture features can be extracted using Gray Level Coocurrence Matrix and the important texture features are,
(i) Autocorrelation is used to detect the repetitive patterns in the image.
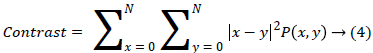
(ii) Contrast finds the amount of local variations situated in the image, If P(x,y) in the matrix has more variations and the contrast will be high. The contrast value can be obtained from
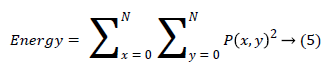
(iii) Energy is also termed as angular moment and it finds repeated pair pixels and detects the disorder in the textures and it produce the higher energy values occur when the gray level distribution has a constant or periodic form.
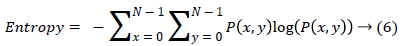
(iv) Entropy is the disorder or complexity of the image. It is very large when the image is not texturally uniform and GLCM have very small values compared to complex textures.
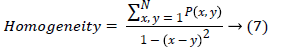
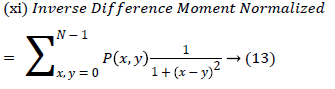
(v) Homogeneity is also termed as Inverse Difference moment and it measure differences in the pair elements.
(vi) Maximum probability finds the most relevant shape in the image,
Maximum Probability = max (P(x,y))→(8)
(vii) Dissimilarity finds the grey level pair variations in an image.
Dissimailarity = Σx,y |x-y| P(x,y)→(9)
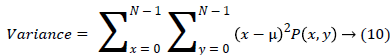
(viii) Variance finds the feature values are relatively high.
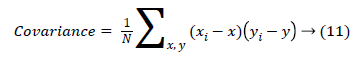
(ix) Covariance measure of the spread or dispersion of data in the corresponding column.
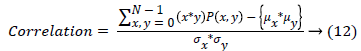
(x) Correlation measures the image gray tone linear dependencies.
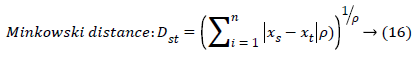
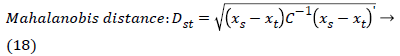
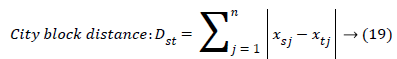
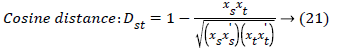
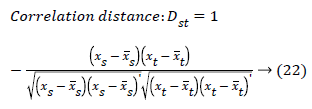
The set of texture features can be selected for dimensionality reduction from the extracted features. The performance of classification can be increased with growing number of texture features. However, performance of classification depends on the number, quality of features and size of a training set. The presence of inefficient features humiliates the classifier performance. The feature selection process can be carried out using Gabor Wavelet to optimize the necessary texture features in an image. The distance vector classifier can be used to find the misclassified pixels in an image. The distance vector parameters used to measure various estimates for further classification are given as,

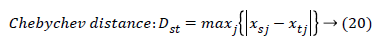
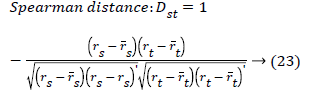
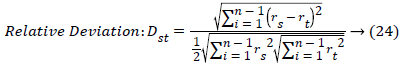
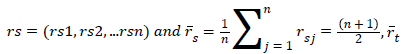
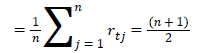
Where rsj is the rank of xsj taken over x1, x2j, …xmj, rs and rt are
the coordinate-wise rank vectors of xs and xt
Classification is the process of classifying the given input by training with a suitable classifier. In the present work, support vector machine, artificial neural network, k-nearest neighbor and the combination as hybrid classifier are used for US kidney image classification.
Results and Discussions
The enhanced US kidney image classification system was implemented using Matlab. The US kidney images in total of 248 images are taken from the available database namely Kidney Image Repository, US-TIP, AIUM, and ARI database. The Fuzzy C means filtering was used to remove the unwanted noises like speckle noise, salt and pepper noise available in the image. In general, the database images are with or without the salt and pepper noise. Hence the noise was added for further removal. In order to get the better performance the noise density level was increased to 0.5 dB with the database images and processed.
Figure 2 shows the sample image before adding noise density, the noisy image after adding 0.5 dB and filtered image. The texture features were extracted using Gray Level Coocurrence Matrix and the feature values are tabulated in Table 1. The feature selection vectors was done to optimize the necessary features in an image by Gabor Wavelet, the feature selection process was carried out using Gabor Energy, Gabor Mean Amplitude, Gabor Moments, Histogram, and Wavelet Moments.

Figure 2: Image (a) Sample Image, (b) Noise image with noise density of 0.5 dB, (c) Fuzzy C means filtered image.
| S.No | Features parameters | Values |
|---|---|---|
| 1 | Autocorrelation | 52.975 |
| 2 | Contrast | 7.934 |
| 3 | Energy | 0.679 |
| 4 | Entropy | 7.3223 |
| 5 | Homogeneity | 1.023 |
| 6 | MaximumProbability | 0.738 |
| 7 | Dissimilarity | 1.536 |
| 8 | Variance | 0.629 |
| 9 | Covariance | 0.618 |
| 10 | Correlation | 0.589 |
| 11 | InverseDifferenceMoment | 1.237 |
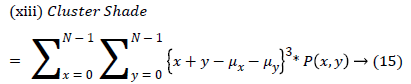
| 12 | ClusterProminence | 4.153 |
| 13 | ClusterShade | 58.671 |
Table 1: Extracted values for the features.
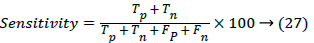
The optimized features were estimated by Gabor wavelet and the features of the destination image required to be predicted. The plots of the Histogram, Gabor Energy and Wavelet Moments of the database US kidney images for Normal and Abnormal Images by Gabor wavelet is shown in Figure 3. The outputs of the feature extraction vectors are then trained and the performance accuracy using various classifier methods were compared. The performances of the various classifiers were evaluated in terms of the sensitivity, specificity and accuracy using various classifiers. The sensitivity of the distance vector classifier method can be estimated using,

Figure 3: (a) Histogram for normal images, (b) Histogram for abnormal images, (c) Gabor energy for normal images, (d) Gabor energy for abnormal images. (e) Wavelet moments for normal images.(f) Wavelet moments for abnormal images.
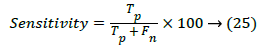
Where Tp is the true positive, Tn is true negative, Fp is the false positive and Fn is the false negative. The Specificity is termed as the negative probability for the image test and it can be estimated by,
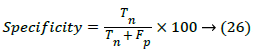
Accuracy is the probability that an image test is performed correctly. It is then found by
The performance of the various classifiers is shown in Table 2. The accuracy, sensitivity and specificity were calculated by comparing the input and the query image to get true positive, true negative, false positive and false negative images in the database.The classifications of the US kidney image using various classifiers are given in Table 3. It is found that the hybrid classifier (SVM with ANN) classifies the normal and abnormal images more accurately then other classifiers. The performance of the developed classification system is compared with the existing classifiers is given in Table 4. The Support Vector Machine with Artificial Neural Network produces a higher accuracy of 99.6%. This is due to the combination of Gray Level Coocurrence Matrix and SVM with ANN for image classification.
| S.No | ImageClassifiers | TotalNo. ofImages |
TP | FN | TN | FP | Sensitivity(%) | Specificity(%) | Accuracy(%) |
|---|---|---|---|---|---|---|---|---|---|
| 1 | Minkowskidistance | 248 | 205 | 23 | 14 | 6 | 97.16 | 62.16 | 91.94 |
| 2 | Euclideandistance | 248 | 200 | 29 | 13 | 6 | 97.09 | 69.05 | 92.34 |
| 3 | Mahalanobis | 248 | 210 | 20 | 14 | 4 | 98.13 | 58.82 | 92.74 |
| 4 | CityblockDistance | 248 | 197 | 24 | 18 | 9 | 95.63 | 57.14 | 89.11 |
| 5 | ChebychevDistance | 248 | 207 | 27 | 12 | 2 | 99.04 | 69.23 | 94.35 |
| 6 | CosineDistance | 248 | 202 | 29 | 15 | 2 | 99.02 | 65.91 | 93.15 |
| 7 | CorrelationDistance | 248 | 206 | 28 | 10 | 4 | 98.1 | 73.68 | 94.35 |
| 8 | SpearmanDistance | 248 | 201 | 32 | 9 | 6 | 97.1 | 78.05 | 93.95 |
| 9 | RelativeDeviation | 248 | 203 | 26 | 18 | 1 | 99.51 | 59.09 | 92.34 |
| 10 | NormalizedSVMwithKNN | 248 | 190 | 31 | 20 | 7 | 96.45 | 60.78 | 89.11 |
| 11 | SVM | 248 | 228 | 14 | 4 | 2 | 99.13 | 77.78 | 97.6 |
| 12 | SVMwithKNN | 248 | 232 | 12 | 3 | 1 | 99.57 | 80 | 98.39 |
| 13 | SVMwithANN | 248 | 237 | 10 | 1 | 0 | 100 | 90.91 | 99.6 |
Table 2: Performance of the various classifiers.
| S.No | ImageClassifiers | Totalno.ofimages | ClassifiedImages | Accuracy(%) | |
|---|---|---|---|---|---|
| Normal | Abnormal | ||||
| 1 | Minkowskidistance | 248 | 103 | 145 | 91.94 |
| 2 | Euclideandistance | 248 | 108 | 140 | 92.34 |
| 3 | Mahalanobis | 248 | 111 | 137 | 92.74 |
| 4 | CityblockDistance | 248 | 109 | 139 | 89.11 |
| 5 | ChebychevDistance | 248 | 99 | 149 | 94.35 |
| 6 | CosineDistance | 248 | 104 | 144 | 93.15 |
| 7 | CorrelationDistance | 248 | 105 | 143 | 94.35 |
| 8 | SpearmanDistance | 248 | 107 | 141 | 93.95 |
| 9 | RelativeDeviation | 248 | 105 | 143 | 92.34 |
| 10 | NormalizedSVMwithKNN | 248 | 98 | 150 | 89.11 |
| 11 | SVM | 248 | 111 | 137 | 97.60 |
| 12 | SVMwithKNN | 248 | 112 | 136 | 98.39 |
| 13 | SVMwithANN | 248 | 115 | 133 | 99.60 |
Table 3: Classification of US kidney image based on image classifiers.
| S.No. | Authors | Techniqueused | Classificationaccuracyin% | ||
|---|---|---|---|---|---|
| Denoising | FeatureExtraction | Classifier | |||
| 1 | Joseetal.[8] | - | DataMining | AssociationRule/NaiveBayes | 92 |
| 2 | Attiaetal. [14] | Medianfilter | DWT | ANN | 97 |
| 3 | Viswanathand Gunasundari[13] |
Gaborfilter | - | ANN | 98.8 |
| 4 | Aslanetal. [18] | - | - | LSSVM | 84 |
| 5 | Premaetal. [9] | Gaussianlow-passfilter | GLCM | KNN | 87.5 |
| 6 | Presentwork | FuzzyCmeansfilter | GLCM | SVM | 97.60 |
| SVMwithKNN | 98.39 | ||||
| SVMwithANN | 99.60 | ||||
Table 4. Comparison of classification accuracy obtained by various methods.
Conclusion
An efficient ultrasound kidney image classification system using various classifiers is presented. The fuzzy c means filtering was used to remove the noises in the image and the texture features were extracted using Gray Level Coocurrence Method. The extracted features were selected using Gabor wavelets and the histogram equalization. The performance of classifiers were estimated and found that the SVM- ANN classifier outperforms other classifiers.
References
- Jebamalar LE, Singh DAAG. Salt and Pepper Noise Detection and Removal in Gray Scale Images. An Experimental Analysis. Int J Signal Process Image Process Pattern Recogn 2013; 6: 343-352.
- Toh KKV, Isa NAM. Cluster Based Adaptive Fuzzy Switching Median Filter for Universal Impulse Noise Reduction. IEEE Transact Consumer Electronics 2010; 56: 2560-2568.
- Shruthi B, Renukalatha S, Siddappa M. Detection of Kidney Abnormalities in Noisy Ultrasound Images. Int J Comput Appl 2015; 120: 28-32.
- Joseph S, Balakrishnan K, Nair BMR, Varghese RR. Ultrasound Image Despeckling using Local Binary Pattern Weighted Linear Filtering. Int J Information Technol Comput Sci 2013; 6: 1-9.
- Onder D, Karacali B. Automated clustering of histology slide texture using co-occurrence based grayscale image features and manifold learning. Biomedical Engineering Meeting, Balcova, Izmir, 2009.
- Raja BK, Madheswaran M, Thyagarajah K. Texture pattern analysis of kidney tissues for disorder identification and classification using dominant gabor wavelet. Machine Vision Appl 2010; 21: 287-300.
- Mohanaiah P, Sathyanarayana P, Guru-Kumar L. Image texture Feature Extraction using GLCM approach. Int J Sci Res Publication 2013; 3: 1-5.
- Jose JS, Sivakami R, Maheswari UN, Venkatesh R. An Efficient Diagnosis of Kidney Images Using Association Rules. Int J Comput Technol Elect Eng 2012; 2: 14-20.
- Akkasaligar PT, Biradar S. Classification of Medical Ultrasound Images of Kidney. Int J Comput Appl 2014; 3: 24-28.
- Christiyana CC, Rajamani VP. Second Order Statistical Texture Features from a New CSLBPGLCM for Ultrasound Kidney Images Retrieval. Appl Med Informatics 2013; 33: 32-39.
- Xie J, Jiang Y, Hung-Tat T. Segmentation of kidney from ultrasound images based on texture and shape priors. IEEE Eng Med Biol Society 2005; 24: 45-57.
- Tamilselvi PR, Thangaraj P. Segmentation of Calculi from Ultrasound Kidney Images by Region Indicator with Contour Segmentation Method. Global J Comput Sci Technol 2011; 11: 42-51.
- Viswanath K, Gunasundari R. Design and analysis performance of kidney stone detection from ultrasound image by level set segmentation and ANN classification. IEEE Conference on Advances in Computing, Communications and Informatics, New Delhi, 2014, 407-414.
- Attia MW, Moustafa HED, Abou-Chadi FEZ, Mekky N. Classification of Ultrasound Kidney Images using PCA and Neural Networks. Int J Advanced Comput Sci Appl 2015; 6: 53-57.
- Thai LH, Hai TS, Thuy NT. Image Classification using Support Vector Machine and Artificial Neural Network. Int J Information Technol Comput Sci 2012; 5: 32-38.
- Madheswaran M, Dhas ASD. Classification of brain MRI images using support vector machine with various Kernels. Biomed Res India 2015; 26: 505-513.
- Zhang H, Berg AC, Maire M, Malik J. SVM-KNN: Discriminative Nearest Neighbor Classification for Visual Category Recognition. IEEE Comput Vision Pattern Recogn 2006; 2: 2126-2136.
- Aslan MS, Munim HAE, Farag AA, Ghar MAE. Assesment of kidney function using dynamic contrast MRI Techniques: In: Biomedical Image Analysis and Machine Learning technologies. IGI Global 2009, 214-232.