Research Article - Biomedical Research (2016) Health Science and Bio Convergence Technology: Edition-I
An efficient approach for detecting exudates in diabetic retinopathy images
NB Prakash1* and D Selvathi21Department of Electrical and Electronics Engineering, National Engineering College, Kovilpatti, Tamil Nadu, India
2Department of Electronics and Communication Engineering, Mepco Schlenk Engineering College, Sivakasi, Tamil Nadu, India
- *Corresponding Author:
- NB Prakash
Department of Electrical and Electronics Engineering National Engineering College India
Accepted on April 11, 2016
Abstract
The blood vessels are responsible for supplying the blood throughout the entire region of the retina. The retinal blood vessels are damaged due to the ageing of the people and other factors such as blood pressure. Exudates lesions are formed in retinal image due to the damage in retinal blood vessels. Ignoring these lesion symptoms leads to the loss of vision, as these symptoms are not exposed easily and requires diagnosis at an earlier stage. In this paper, the hard and soft exudates are detected and segmented using mathematical morphological operations. The proposed algorithm for soft and hard exudates detection is applied over the retinal images of MESSIDOR dataset. The sensitivity of 96.1% and specificity of 94.6% are achieved for soft exudates detection. The sensitivity of 98.71% and specificity of 99.56% are achieved for hard exudates detection.
Keywords
Blood vessels, Exudates, Symptoms, Morphological, Vision.
Introduction
Diabetic Retinopathy (DR) is a retinal disorder in diabetic patients. Retinal image processing plays an important role in the process of detection and diagnosis of DR. Early treatment of DR prevents the vision loss in diabetic patients. The retina consists of blood vessels, Optic disc (OD) and Optic cup as shown in Figure 1A. The blood vessels originate from the center of the OD and spreads over the entire region of the retina. The thin blood vessels are damaged due to the high pressure in blood vessels which breaks the thin blood vessels and the broken vessels leaks the lipids and proteins around the retina. These lipids form the abnormal lesions in the retina. The abnormal lesions are categorized into exudates, cotton wool spots, microaneurysms and hemorrhages. The presence of exudates in and around the macula region leads to the formation of macula edema [1] in the diabetic patients. In this paper, the computer aided automatic detection of exudates is proposed.

Figure 1. (a) Structure of retina; (b) Illustration of exudates.
Exudates are randomly spread over the retina and appear as yellow-white patches of varying sizes and shapes as shown in Figure 1B. Exudates are classified into two types as hard and soft exudates. The hard exudates are intra-retinal fatty lesions which are the important sign of the DR and macula edema. In this paper, the detection of exudates are concentrated which correlates the DR and macula edema to prevent the earlier vision loss in diabetic patients. On the other hand, the detection of exudates for the large number of images in every year is a very expensive and time consuming process. This will also lead to human error in the detection of exudates. The main objective of this paper is to develop an efficient system for the automatic detection of exudates in the retinal images using morphological operations.
Literature Survey
Phillips et al. [2] proposed a method for exudates detection using global and local thresholding method. The photographic non-uniformities were suppressed before the exudates detection process. The contrast of the retinal image was further improved and then thresholding was applied to segment the exudates pixels in the retinal images. The authors achieved 61% of sensitivity and the main limitation of this work was that the cotton wool spots were mistakenly identified as exudates. Sinthanayothin et al. [3] devised an abnormal lesion exudates detection algorithm using the recursive region growing technique by integrated with multiple thresholding technique. The author failed to consider the other bright abnormal lesions which were identical to the exudates. The researcher applied their algorithm on a small dataset comprising of 21 abnormal and 9 normal fundus images. The researcher achieved 88.5% sensitivity and 99.7% specificity in detecting the exudates lesions. Osareh et al. [4] used Intelligence-Based Approach for the detection of exudates in the retinal images of the diabetic patients. Fuzzy c means clustering technique was used to cluster the pixels and further color enhancement process was done. The features as color, size, edge strength, and texture were extracted from these clustered regions and they were ranked by genetic algorithm. The selected features set were trained and classified using multilayer neural network classifier. The authors achieved 93.5% sensitivity and 92.1% predictivity for exudates segmentation.
Agurto et al. [1] have detected the exudates in macula region to identify Clinically Significant Macular Edema (CSME) to prevent earlier vision loss in diabetic patients. The exudates detection was based on the feature set as color, shape, size and intensity. All these extracted features were classified using partial least square algorithm. The authors achieved 96% average detection accuracy on the publicly available retinal image dataset MESSIDOR. Elbalaoui et al. [5] presented a method for exudates detection using Contrast local adaptive histogram equalization and median filtering. In this work, the retinal image was converted into Hue-Saturation-Intensity (HIS) model, then its contrast was improved using the proposed histogram technique and the exudates were detected by applying median filtering. Usher et al. [6] utilized adaptive intensity thresholding method combined with Recursive Region Growing Segmentation (RRGS) to detect the exudates in retinal images.
Most of the conventional methods for exudates detection were based on thresholding technique and supervised-unsupervised classifier. However, the direct application of thresholding on color spaces can be problematic due to significant spatial illumination variations. In this paper, morphological operations based exudates detection methodology is proposed to eliminate such limitations in the conventional methods.
Materials and Methods
Materials
In this paper, publicly available dataset MESSIDOR is used.
MESSIDOR dataset
This dataset [7] is used for the detection and segmentation of exudates and its performance analysis for DR severity classifications. This dataset contains 148 images with exudates and 233 exudates-free images. The specialists' annotations on the 148 images are given in the form of a binary mask. They correspond to the position of each exudate as marked by a dot or a small region, which are noticed as ground truth images. The colour video 3CCD camera on a Topcon TRC NW6 nonmydriatic radiograph is used to capture the retinal images in this dataset. All the images are acquired with the field of view (FOV) of 45°.
Hard exudates detection
Hard exudates are yellowish-white in colour and presents in and around the macula region [4,6]. The RGB retinal image having exudates of diabetic patients (Figure 2A) is first converted into grey scale image (Figure 2B). Then the blood vessels are detected and eliminated to overcome its resemblance with the hard exudates present in the retinal image. Morphological operations [5] are used to eliminate the blood vessels. A flat disc shaped structuring element 12 pixel is used in this paper to construct the morphological mask. Then, the morphological close operation [5] is applied over the grey scale image with constructed morphological mask. The morphological close operation is a dilation followed by erosion, using the same structuring element for both operations. It is used to merge the small pixel regions in the grey scale image together by filling in the gaps between them and by smoothing their outer edges which removes the blood vessels and performs impainting [8] on the grey scale image as shown in Figure 2C.

Figure 2. (a) Retinal image showing exudates; (b) Grey scale image; (c) Impainted grey scale image showing exudates and optic disc.
The correlation function of linear filtering algorithm [9] is now applied on the impainted image. Correlation is equivalent to two-dimensional convolution with Kirsch’s kernel [10] filter matrix. It rotates the default Kirsch’s kernel to 180° as north, east, west, south, north-west, north-east, south-west and south-east to create eight convolution kernels [10]. The corresponding individual pixel values in eight filtered response images are grouped and the maximum response pixel value is chosen from these eight individual corresponding pixels. The same procedure is applied for the remaining pixels in eight filtered images in order to produce the final maximum response integer image. Now, the maximum response binary image (Figure 3A) is created by applying logical function [11] on the maximum response integer image. Finally, morphological area opening is applied on maximum response binary image to segment the hard exudates in the retinal images (Figure 3B). The detected hard exudates are shown in Figure 3C.

Figure 3. (a) Maximum Response binary image; (b) Morphological area opened image; (c) Hard exudates detected image (green).
Soft exudates detection
A cotton wool spot [12] is sometimes known as soft exudates. They are flat-reddish white in color and obscure underlying the retinal blood vessels (Figure 4A). Initially, the retinal image is converted into grey scale image (Figure 4B). The detection of soft exudates is explained in the following section. The histogram equalization technique [2] is applied on the grey scale image to obtain Ehist and it is shown in Figure 5A. The histogram equalization over the grey scale image is described as,

Figure 4. (a) Retinal image showing soft exudates; (b) Grey scale image.

Figure 5. (a) Histogram equalized image (Ehist); (b) Morphologically opened image (Ehist-cc1); (c) Morphologically opened image (Ehist-cc2); (d) Absolute subtracted binary image; (e) Soft exudates detected image; (f) Exudates (both hard and soft) detected image.
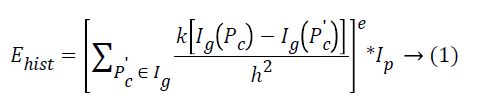
Where:
Ip is the maximum pixel intensity (255)
Pc is the center pixel of 3*3 mask window (h)
Pʹc is the neighborhood pixel of center pixel Pc
e is the square root of the size of mask window
The values of h and e are chosen to be 9 and 3 after several iterations, respectively.
Then, determine the connected components of histogram equalized image by applying binary morphological opening [5] which removes all connected components (objects) that have fewer than 50-connected neighborhood pixels (by several iterations), producing another binary image Ehist-cc1 and shown in Figure 5B.

Then, determine the connected components of Ehist-cc1 and removes connected components that have fewer than 500- connected neighborhood pixels (by several iterations), producing another binary image Ehist-cc2 and shown in Figure 5C.

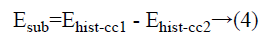
The absolute binary subtracted image is constructed by subtracting the image Ehist-cc2 from the image Ehist-cc1, shown in Figure 5D, which clearly depicts the soft exudates in the retinal image. The overlay of soft exudates in the RGB retinal image is shown in Figure 5E.
The detected hard and soft exudates are depicted in Figure 5F.
Results and Discussion
This section describes the performance evaluation details of hard and soft exudates, in detail with state of arts methodology. The proposed algorithm is applied on the MESSIDOR dataset images and results for exudates are obtained. The MATLAB R2012 version is used in this work for simulation and it takes approximately 6 seconds per image on an average to run on Intel Pentium core i5 processor with 1 GB of internal RAM. To evaluate the performance of the exudates detection algorithm stated in this paper, the publicly available dataset ‘MESSIDOR’ is used. The performance of proposed exudates segmentation results are analysed with respect to ground truth images, which are obtained from expert ophthalmologist. The following performance evaluation parameters (Marín et al.) [13] are used to validate the proposed exudates segmentation results and they are given in Equations (5) and (6).
Sensitivity (Se)=TP/(TP+FN)→(5)
Specificity (Sp)=TN/(TN+FP)→(6)
Sensitivity is defined as the ratio between the number of TP and the sum of the total number of TP plus FN. The value of sensitivity lies between 0 and 1.
Specificity is defined as the ratio between the number of TN and the sum of the total number of FP plus TN. The value of specificity also lies between 0 and 1. The parameter sensitivity and specificity are calculated with respect to ground truth images available in the corresponding datasets. The value of Se and Sp should be high for better exudates segmentation results. The True Positive refers rightly detected exudates pixels and True Negative refers untrue detected exudates pixels. False Positive refers to the rightly detected non-exudates pixels and False Negative refers to the untrue detected non-exudates pixels.
The conventional methods were not providing optimum results for further detection and screening of diabetic retinopathy by detecting the abnormal lesions in the retinal images. Our approach detects and segments hard and soft exudates from the retinal images by implementing morphological operations, thus increases the performance of the exudates segmentation. The proposed exudates detection algorithm achieves better average sensitivity and specificity in abnormal retinal images for the retinal images available in MESSIDOR dataset. The obtained results are tabulated in Tables 1 and 2. The graphical illustration for the comparisons of the hard exudates is given in Figure 6.

Figure 6. Performance comparison of the hard exudates segmentation.
| Methodology | Se (%) | Sp (%) |
|---|---|---|
| Proposed | 98.71 | 99.56 |
| Tripathi et al. [14] | 97.66 | - |
| Osareh et al. [4] | 93.5 | 94.6 |
| Niemeijer et al. [15] | 95.5 | 86 |
| Akram et al. [16] | 97.04 | - |
| “-” indicates that this information was not available. | ||
Table 1. Performance comparison of the hard exudates segmentation.
| Methodology | Se (%) | Sp (%) |
|---|---|---|
| Proposed | 96.1 | 94.6 |
| Pires et al. [17] | 93 | - |
Table 2. Performance comparison of the soft exudates segmentation.
The proposed algorithm segments the hard exudates at an average sensitivity rate of 98.71% and specificity rate of 99.56% respectively. The proposed algorithm segments the soft exudates at an average sensitivity rate of 96.1% and specificity rate of 94.6%, respectively. Tables 1 and 2 compare the results obtained with other state of arts. The graphical illustration for the comparisons of the soft exudates is given in Figure 7.

Figure 7. Graphical plot of soft exudates segmentation performance comparisons.
Conclusion
In this paper, the abnormalities associated with Diabetic Retinopathy have been studied. This proposed method can help the ophthalmologists to detect Exudates in Diabetic Retinopathy screening process. All of the results are evaluated with ground truth images obtained from expert ophthalmologists. The proposed algorithm segments the hard exudates at an average sensitivity rate of 98.71% and specificity rate of 99.56% respectively. The proposed algorithm segments the soft exudates at an average sensitivity rate of 96.1% and specificity rate of 94.6%, respectively. The results show that, this proposed methodology is well suited for the early diagnosis of the Diabetic Retinopathy disease. In future, by evaluating the exudates and fovea region, the severity of DR can be easily identified to prevent vision loss in the diabetic patients.
References
- Agurto C, Murray V, Yu H, Wigdahl J, Pattichis M. A Multiscale Optimization Approach to Detect Exudates in the Macula. IEEE J Biomed Health Informatics 2014; 18: 4.
- Phillips R, Forrester J, Sharp P. Automated detection and quantification of retinal exudates. Graefe’s Arch ClinExpOphthalmol 1993; 231: 90-94.
- Sinthanayothin C, Boyce JF, Williamson TH, Cook HL, Mensah E, Lal S. Automated detection of diabetic retinopathy on digital fundus images. Diabetic Med 2002; 19: 105-112.
- Osareh A, Shadgar B, Markham R. A Computational-Intelligence-Based Approach for Detection of Exudates in Diabetic Retinopathy Images. IEEE Transact InformaTechnol Biomed 2009.
- Elbalaoui A, Boutaounte M, Faouzi H, Fakir M, MerbouhaA. Segmentation and Detection of Diabetic Retinopathy Exudates. IntJ ComputAppl 2014; 91: 7-13.
- Usher D, Dumskyj M, Himaga M. Automated Detection of Diabetic Retinopathy in Digital Retinal Images: A Tool for Diabetic Retinopathy Screening. Diabetic Med 2004; 21: 84-90.
- http://messidor.crihan.fr/download-en.php
- Criminisi A, Prez P, Toyama K. Region filling and object removal by exemplar-based image impainting. IEEE Trans Image Process 2004; 13: 1200-1212.
- Padmavathi G, Subashini P, Kumar MM, Thakur SK. Performance analysis of Non Linear Filtering Algorithms for underwater images. Int J Comp SciInf Security 2009; 6: 232-238.
- Kirsch RA. Computer determination of the constituent structure of biological images. Comput Biomed Res 1971; 4: 315-328.
- Van den Boomgard R, van Balen R. Methods for Fast Morphological Image Transforms Using Bitmapped Images. CVGP: Graphic Model Image Process 1992; 54: 252-254.
- Andreoli MT, Lim JI. Cotton-wool spots and retinal hemorrhages, Interferon-associated retinopathy.JAMA Ophthalmol 2014; 132: 503-505.
- Marín D, Aquino A, Gegúndez-Arias EM, Bravo JM. A new supervised method for blood vessel segmentation in retinal images by using gray-level and moment invariants-based features. IEEE Transact Med Imag 2011; 30: 146-158.
- Tripathi S, Singh KK, Singh BK Mehrotra A. Automatic Detection of Exudates in Retinal Fundus Images using Differential Morphological Profile. Int J EngTechnol 2013; 5: 3.
- Niemeijer M, van Ginneken B, Staal J. Automatic detection of red lesions in digital color fundus photographs. IEEE Trans Med Imaging 2005; 24: 584-592.
- Akram UM, Khan A. Automated detection of dark and bright lesions in retinal images for early detection of diabetic retinopathy. J Med Sys 2012; 36: 3151-3162.
- Pires R, Jelinek HF, Wainer J, Valle E, Rocha A. Advancing Bag-of-Visual-Words Representations for Lesion Classification in Retinal Images. PLOSONE 2014.