Research Article - Biomedical Research (2016) Computational Life Sciences and Smarter Technological Advancement
Accident and traffic analysis using GIS
Anitha SD Selvasofia1*, Prince G Arulraj21Department of Civil Engineering, SNS College of Technology, Coimbatore, Tamil Nadu, India
2Department of Civil Engineering, Karunya University, Coimbatore, Tamil Nadu, India
- *Corresponding Author:
- Anitha SD Selvasofia
Department of Civil Engineering
SNS College of Technology
India
Accepted date: August 03, 2016
Abstract
Road traffic accidents have been recognized as one of those adverse elements which contribute to the suffocation of economic growth in the developing countries, due to the heavy loss related to them, hence causing social and economic concern. Traffic safety is an important key and plays an integral role in sustainable transportation development areas. Now days, the main negative impact of modern road transportation systems are loss of property injuries and deaths in road accidents. The success of traffic safety and highway improvement programs hinges on the analysis of accurate and reliable traffic accident data. This study analysis the present state of traffic accident information on three highway namely NH 47 Gandhipuram to Avinashi, NH-209 from Gandhipuram to Annur and NH 67 Gandipuram to Mettupalayam, Coimbatore District. It also discusses the Identification of high accident rate locations suggested using an ArcGIS Software and safety deficient areas on the highways. As the remedial measures are implemented in those accidental locations (Black Spots) the incidents of accident may be reduced.
Keywords
Black spots, ArcGIS, Road traffic accidents.
Introduction
Methodologies for predicting accidents have been widely studied in the past. The prediction models are mostly causative types in which the number of accidents is taken as a function of number of independent variables. Recently there have been studies to identify accident-prone locations using fuzzy and neural network classifier approaches. However such methods are highly dependent on traffic flow data like Average Daily Traffic and the data collected by the traffic police from the accident sites. But traffic flow data are rarely available in sufficient quantity or accuracy to justify these regression approaches. Moreover the traffic police may not be able to collect all the necessary data required to carry out the analysis using that data. Considering all the factors mentioned above, it is necessary to develop a model which can assist in predicting Risk zone on a given road network. This paper describes a model developed to identify black spots on roads using Kernel and Overlay analysis in GIS. GIS is location based information to analyze the spatial and non-spatial data. Hence a model for identifying accident spot location on roads can be easily integrated using GIS [1-6].
Study area
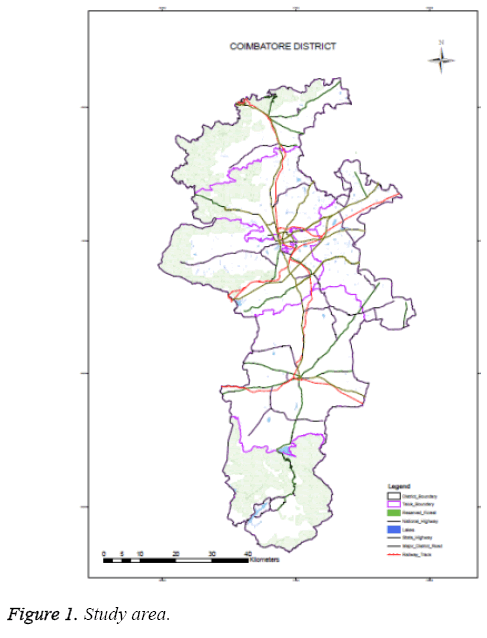
Coimbatore is the second upcoming smart city in India and is called as Manchester of South India. The longitude of Coimbatore lies between 76.65 decimal degrees-77.29 decimal degrees. The latitude lies between 10.22 decimal degrees-11.41 decimal degrees. The total area of Coimbatore is 471 Square Kilometers (Figure 1).
Coimbatore Corporation has eight blocks, One Corporation, 228 Village Panchayast, 44 Town Panchayats and 6 Municipalities. The percentage of population in Coimbatore is 89.23. The population density is higher in urban and semi urban areas when compared to the rural areas i.e Village Panchayats. There are four National Highways which connect three states (Tamil Nadu, Kerala, Karnataka). NH roads are designed for the people to pass through the city which results in heavy traffic congestion.
Methodology
The step by step procedure is explained below
Data collection
To determine the accident prone zones and traffic congestion, data are collected from respective departments. Data are classified into two i.e. spatial and non-spatial data.
Spatial data
The spatial data provides exact geometric information such as location, boundary extend and road network. The Open Series Map (OSM) was obtained from survey of India, Updated taluk map was obtained from survey and settlement department and road network map was obtained from Highways Department.
Non-spatial data
The available information about spatial data is called non- Spatial data. The accident details include date of accident, Time, Type of Accidents, Vehicles involved, Gender, Licensed or Non Licensed, Drunk and drive etc. These details were collected from commissionarate of police, Coimbatore. The bus stop details such as bus route and Number were obtained from Coimbatore transport Corporation. The Hospital Information was gathered from the Coimbatore Health Department.
Data processing
The Ground Control Points (GCP) were collected with the help of hand held GPS in WGS1984 datum. The accident spot locations are converted into shape files using ArcGIS software. The accident details were added as attribute data. The OS maps were geo-referenced using the given location. All OSM maps were mosaic into a single map. The updated taluk and road network map were geo-referenced using the geo-referenced OSM to identify the current taluk and Road Network. Digitized method is used to extract the vector data from the base raster data. The extracted layers are district boundary, taluk boundary, National Highways, State Highways, Major District Roads, Railway line, Reserved forest and lakes. These layers were saved as shape files. These extracted and generated layers are added into the geo database.
Analysis and Results
Buffer analysis
The buffer analysis was used to create the buffer polygon to find the in and around accident location. The bus stop locations were buffered to 500 m radius with reference to accident spot. When the accident spot is overlaps with the buffered radius, the bus stops were removed to minimize the accident congestion. Table 1 gives the details of the bus stops that are removed due to overlapping.
| S.No | Congested Bus Stops | Longitude | Latitude | Reasons for Removal |
|---|---|---|---|---|
| 1 | GCT Stop-Thadagam Road | 76.96 | 11.015 | Bus stops were overlaid with Accident Hot spots and if the stops were within 500m from hotspots, the stops were removed. |
| 2 | Anuvai Temple Stop-Thadagam Road | 76.95 | 10.99 | |
| 3 | LIC Signal Stop-Avinashi Road | 77.09 | 11.06 | |
| 4 | Nava India Stop-Avinashi Road | 77.018 | 11.024 | |
| 5 | Aathupalam-Perur Road | 79.91 | 10.97 | |
| 6 | Avinashilingam College Stop | 76.99 | 11.01 | |
| 7 | TVS Stop-Mettupalayam Road | 76.95 | 11.02 | |
| 8 | Bharathi Nagar-Sathy Road | 76.98 | 11.04 |
Table 1: Removal of bus stops in NH roads.
Accident spot
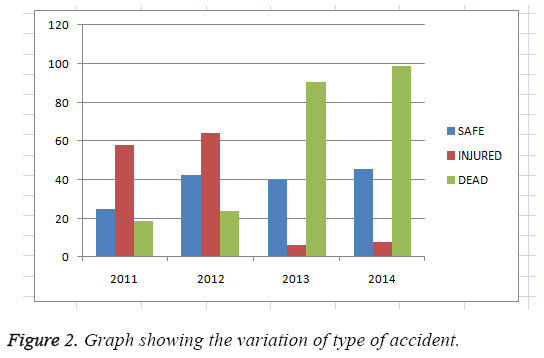
The accident spots are visualized by overlaying the accident location with the National Highway road. Figure 2 shows the various Types of Accidents Involved (safe, injured and death) with respective to years.
Accident hot spot
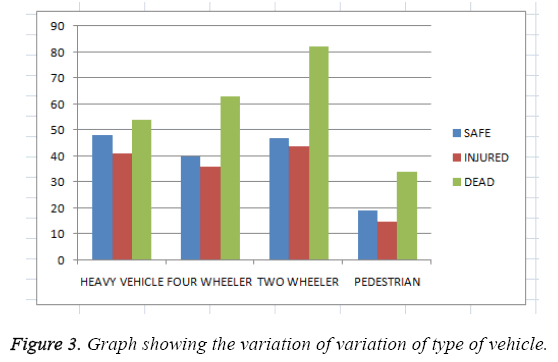
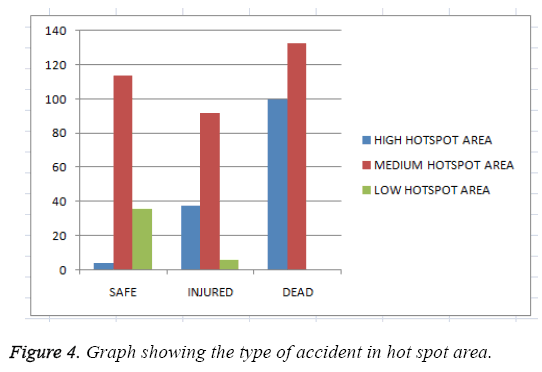
Accident hot spots are classified into three categories based on a rank based analyzing system. The base rank depends on various samples. Figure 3 shows the variations of vehicles involved in the hot spot area. Figure 4 shows the type of vehicles involved in occurrence with respect to years.
Kernel density analysis
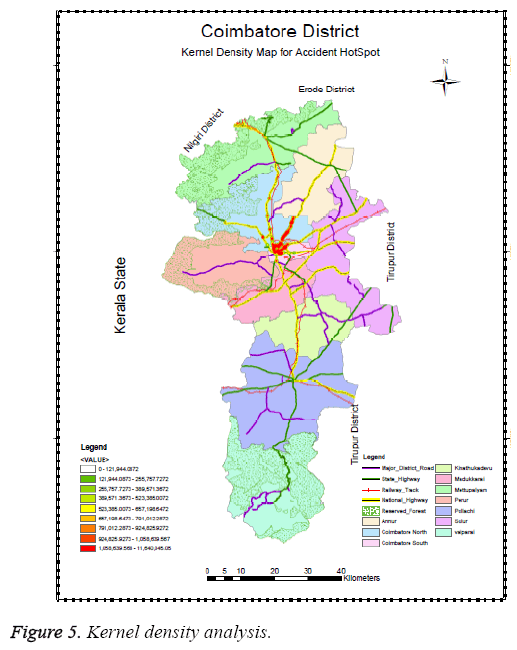
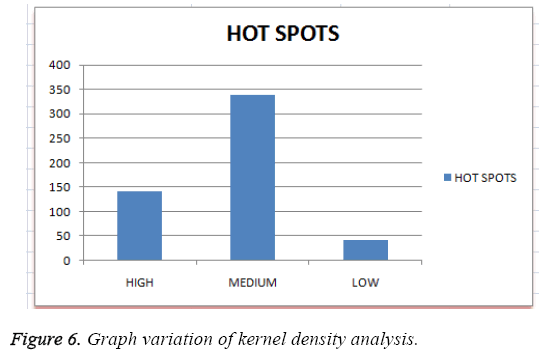
Kernel density analysis is used to find the accident probability zone by using accident hot spot information. The probability zones are classified into High, Medium, and Low. It displays the dangerous zone in red Colour (Figures 5 and 6).
Medical information
The GIS analysis will also display the multi-speciality hospitals near the accident hot spot. This information can be used to find the distance between the accident spot and the multi-speciality hospital. The time taken to travel can also be determined.
Police jurisdiction
Analysis was also made to determine the accident spots that come under the jurisdiction of a particular police station.
Overlay analysis
Overlay analysis is a group of methodologies applied in optimal site selection or suitability modelling. It is a technique for applying a common scale of values to diverse and dissimilar inputs to create an integrated analysis.
Weighted sum
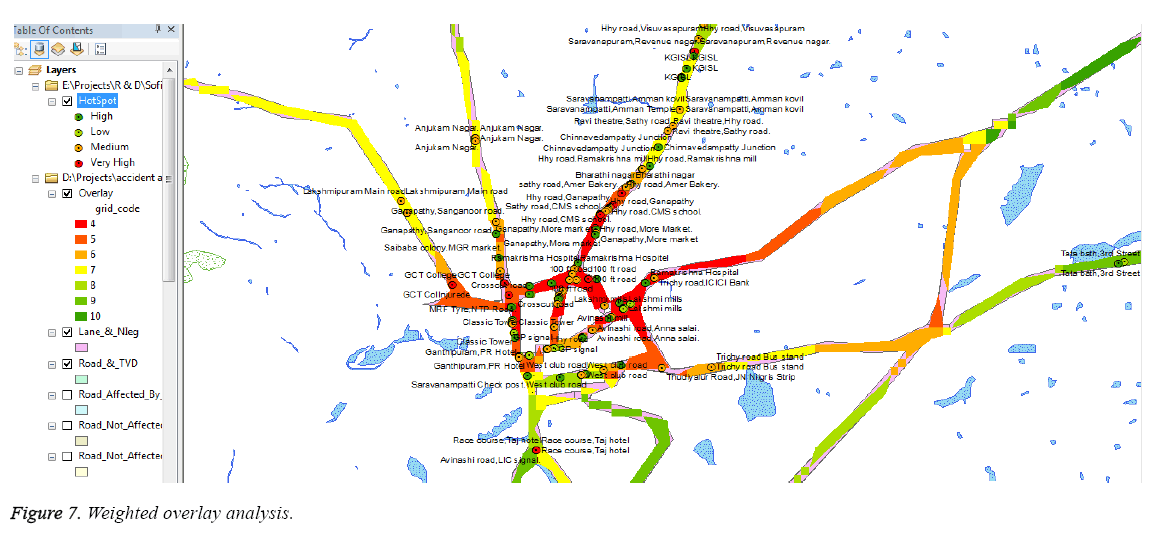
Weighted Sum overlay analysis follows the same general steps of the overlay analysis described above. Using the Weighted Sum tool, complemented by other Spatial Analyst tools, an additive overlay analysis can be implemented. The values for the input layers need to be reclassified prior to using the Weighted Sum tool. Unlike the weights in the Weighted Overlay tool, the weights assigned to the input rasters can be any value and do not need to add to a specific sum. When adding the input rasters, the Weighted Sum tool output values are a direct result of the addition of the multiplication of each value by the weights. Unlike Weighted Overlay, the values are not rescaled back to a defined scale; therefore, it maintains the attribute resolution of the values entered in the model. Weighted Sum assumes that more favorable factors result in the higher values in the final output raster, therefore identifying these locations as being the best (Figure 7).
Local body
Analysis was also made to determine the accidents spots that come under the local bodies so that the local bodies can take up necessary measures such as widening of roads, Construction of speed breakers, Construction of medians etc to reduce the accidents. The local body areas where the accident rates are high are Periyanayakampalayam, Sarcarsamakulam, Thondamuthur, Madukkari and sulur. The suggestions to reduce the accidents are:
1. Increase the number of lanes from two lanes to four lanes.
2. Provide footpath on both the sides of the road for the safety of pedestrians.
3. Provide adequate drainages.
4. Provide separate bus bays for avoiding delay of other vehicles at the bus stops.
5. Take suitable enforcement measures to reduce the speed of vehicles.
6. Remove or repair potholes for the safety of road users.
7. Reduce number of U-turning and provide adequate length and width for median openings.
8. Provide necessary sign boards at T-junctions.
Web information system
The following information is hosted in the web for the future updation and to act as user friendly to the public users. The link is www.aiscbe.in
Conclusion
The study was an attempt to find out the most vulnerable accident locations or the black spots in Coimbatore districts making use of GIS. The Weighted Overlay Analysis method was used to rank the accident locations. Based on the analysis, Periyanayakampalayam, Sarcarsamakulam, Thondamuthur, Madukkari and sulur were identified as most vulnerable accident locations and suggested some possible alternative or corrective measures to improve the transportation system in these locations, from which the decision maker can select suitable measure for the location. The method is found to be effective in identifying the black spots, provided sufficient secondary data is available.
References
- Yalcin G, Duzgun HS. Spatial Analysis of Two - Wheeled Vehicles Traffic Crashes: Osmaniye in Turkey. KSCE J Civil Eng 2015; 7: 2225-2232.
- Cairda KJ, Johnstonb AK, Chelsea R, Willness C, Asbridge DM, Steele P. A meta-analysis of the effects of texting on driving. Accident Anal Prevent 71: 311-318.
- Jonasson KJ, Rootzén H. Internal validation of near-crashes in naturalistic driving studies: A continuous and multivariate approach. Accident Anal Prevent 62: 102-109.
- Sorate RR, Kulkarni RP, Bobade SU, Patil MS, Talathi AM, Sayyad IY, Apte SV. Identification of Accident Black Spots on National Highway 4 (New Katraj Tunnel to ChandaniChowk). IOSR J Mech Civil Eng 2015; 12: 61-67.
- DholiaP, Shinkar P. Identification of Accident Prone Stretches in Urban Area a Case Study of Rajkot City.Int J SciRes Develop 2016; 4: 1722-1725.
- Kumar DM, ArunJ, Pradeep R. Vehicle Speed Monitoring System For Safe Riding And Minimising Accident In Prone Area.IntJ Res Electric Eng2016; 3:2349-2503.
