Research Article - Journal of Biomedical Imaging and Bioengineering (2017) Volume 1, Issue 1
A seed yield estimation modelling using classification and regression trees (CART) in the biofuel supply chain.
Srinivasan SP1* and Shanthi DS2
1Department of Mechanical Engineering, Raja Lakshmi Engineering College, India
2Department of Computer Science and Engineering, Raja Lakshmi Engineering College, India
- *Corresponding Author:
- S. P. Srinivasa
Department of Mechanical Engineering
Raja Lakshmi Engineering College, India
E-mail: spsrini@rediffmail.com
Accepted date: July 06, 2017
Citation: Srinivasan SP, Shanthi DS. A seed yield estimation modelling using classification and regression trees (CART) in the biofuel supply chain. J Biomed Imag Bioeng. 2017;1(1):8-12.
Abstract
Cultivating Jatropha plant in the barren lands is the main focus of this paper. This in turn targets concern about, the biofuel production and providing a source of income to the barren land owners. Hence the decision making of cultivating the Jatropha plant is done by predicting the Jatropha seed yield for the given set of barren lands. The prediction of yield estimation of Jatropha seed through identification of attributes which affects the crop yield and growth characteristics of Jatropha seed can support the farmers in the decision-making process of cultivation. This plays a vital role in the harvest management of Jatropha seed. The Information Technology has also emerged into the agricultural sector, hence an indirect measurement of crop yield through challenging knowledge discovery techniques have become an active subject in the field of agriculture and supply chain network. A classification modeling is used effectively to estimate the probabilities of attributes in predicting the yield, which in turn influences biofuel production and its entire supply chain. This research aims at the successful convention of the tree based classifier CART in order to predict the yield estimation of Jatropha seed by applying it on the agricultural dataset. The performance of tree-based classifier- CART is being evaluated through the free and open source data mining software ‘R’ Language on the agricultural dataset.
Keywords
Jatropha seed; Yield; CART; Supply chain
Introduction
The major focus of this research is to utilize the barren lands for cultivating Jatropha seeds, in turn targeting concern on energy security, at the same time providing a supplementary source of income for the land users, as a part of it the crop yield of Jatropha seeds is needed to be identified for the given set of barren lands The yield of Jatropha has been predicted for a given set of barren lands [1,2].
The prediction of Jatropha yield has two important steps, including, the identifying the external attributes affecting the yield and changing the growth characteristics of Jatropha seed [3-5]. Prediction of Jatropha yield is one of the most important factors in implementing a supply chain model for distributing Jatropha seeds. The effectiveness of prediction affects the functional characteristics of supply chain network designed.
Jatropha seeds
The non-edible vegetable oil extracted from the Jatropha Caracas plant is used as an alternative to the diesel oil. It has many prominent qualities which include it in the productivity of biofuels, like, producing seeds with rich oil content, a plant which can be grown in drought lands with marginal/poor soil, grows quickly and provides seeds for several years. Especially it acts as a distinct and a suitable alternative to other food crops which are used in the production of biofuel [6].
In India, biofuel production depends mainly on the cultivation and processing of Jatropha plant seeds which are very rich in oil [1]. These commercially feasible energy crops as they are high yielding can cope with a variety of soils and climatic conditions. Selecting the extraction conditions for Jatropha oil from its seed is being done through nonlinear mathematical programming [7-12]. It has guaranteed the requirements of using this oil as a feedstock for biodiesel production.
The usage of Jatropha oil in diesel generators and engines is very much common now and the oil is used as such without any refinement after extraction. Its prominent qualities allow economic benefits to economically weak farmers. The farmers can cultivate the plant in their barren lands, which can provide a supplementary source of income for them [6]. The kinetic viscosity of Jatropha oil is higher and its calorific value is near to fossil fuel. It requires more supply of water and nutrition. It contains toxic phabol ester and good carbon sink capability and reduces the CO2 emission [13]. Especially in India, for producing biofuel, Jatropha seed oil is accepted politically and morally, as no food producing farmlands are required for the plant cultivation.
Tree based classifier-CART (classification and regression trees)
Data mining is a knowledge discovery process, which is essential to mine knowledge from large amounts of data. Classification is one of the Data mining functionality which can be applied on any dataset (Collection of Data) from which knowledge can be extracted in specific patterns required by the users. Many classification techniques or algorithms have been developed to deal with millions of records (data) in a database having several or even hundreds of attributes (columns in a Database) [14-16].
The cart algorithm can determine the complex interactions among the attributes in the final tree. This is used to identify and define the interactions in a multivariate logistic regression model [2]. Classification algorithms are widely used in various fields of interest, such as customer behavior analysis, yield analysis, biological data analysis, and intrusion deduction analysis and in surveillance, tracking system [17]. A classification is a form of data analysis that is used to extract model describing important data classes. In the case of the Jatropha yield estimation, classification of the yield (termed as classes) is specified as High, Average and Low. Classification is a two-step process; the first step is the learning step which builds a classifier (model) that describes a predetermined set of data classes or concepts. The training data are analyzed by a classification algorithm, which ends up with a learned model or classifier. The second step is the classification where the test data are used to estimate the accuracy of the classifier. If an acceptable level of accuracy is attained, then the classifier can be used to classify the new data tuples [18].
The CART algorithm produces a decision tree by applying a binary recursive partitioning procedure capable of processing continuous and nominal attributed both as targets and predicts where each internal node has exactly two outgoing edges [3]. The data are randomly divided into a training set and a testing set [11]. The testing set is used to evaluate over fitting of the model to the training set. The CART algorithm uses Gini Index is used as the splitting criteria which measure the impurity in the given dataset. It considers a binary split for each attribute and computes the weighted sum of both the parts. In addition to the decision, tree CART has the ability to generate regression tree where the leaves predict a real number based on the weighted mean. The CART algorithm handles missing values too. It also allows dynamic feature construction and cost sensitive learning [4].
Methods and Materials
The initial stage of supply chain network of Jatropha seed is the identification of yield estimation attributes. Based on survey and expert opinion, the temperature is one of the main attributes that can affect the cultivation of Jatropha. Jatropha caucus is found to grow in the tropical and monsoon climate. About 95% of the Jatropha cultivation is found in the land where the annual temperature ranges between 20 and 27 degree Celsius. Secondly, irrigation is needed during the first two years of the plantation. The necessary of water depends on the type of soil and the climate. In that case, drip irrigation is the best to keep the soil moist at all times [10]. The plant can survive on dryness by using the humidity present in the air. Jatropha can grow in medium to dry regions with the annual rainfall ranging from 200 to 1500 mm. Thus the above three attributes, Temperature, Irrigation and Rainfall have taken into consideration for the yield estimation of Jatropha seed [14]. The Framework of the proposed system is depicted in Figure 1.

Figure 1: Framework of Proposed System.
The data set used in the framework for predicting Jatropha seed yield estimation is viewed from the perspective of both the training phase and testing phase. The training phase performs the learning process by generating a decision tree (classifier) for classification. The test phase determines the accuracy of the classifier. Various performance metrics such as sensitivity, specificity, precision, accuracy are considered and analyses of the classifier are done, in order to evaluate the yield estimation decision.
Pseudo for CART classification algorithm
Input: Training Data (D)
Method: CART classification
Output: Decision tree (defining the classes)
1. Extract the training data set (D).
2. Let IA be the input attribute & TA be the target attribute.
3. Construct the root node which contains the whole training data.
4. Compute the Gini index for all the IA, using the following formula.
5. Gini (D) is termed as Gini index of the entire data set, GiniA(D) termed as Gini index for an attribute.
6. 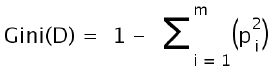
7. GiniA(D)= (D1/D) Gini (D1) + (D2/D) Gini (D2)
8. Where pi is the relative frequency of the target class in D.
9. Let X be the split attribute with minimum Gini index (GiniA(D)) among IA.
10. Partition the D according to the value of X.
11. Create a new node as a child of the current node for each subset and passes the instance in the subset of the node.
12. Repeat step 3 to 7 recursively until the following stopping criterion is met,
13. All instances in the D belong to the same class value.
14. Maximum depth has been reached.
15. The number of cases in the leaf node is less than the minimum number of cases of a parent node.
The best splitting criteria is not greater than a certain threshold
Discussions
The climatic data collected for a period from 1980 to 2002 for all the districts in Tamil Nadu are presented in Table 1, is taken as the training data [9]. CART algorithm is applied to the data set to predict the yield estimation of Jatropha seed and the performance measures like accuracy, precision, sensitivity, and specificity are measured.
| S.No | Year | District | Temp | Rainfall | Irrigation | Yield |
|---|---|---|---|---|---|---|
| 1 | 1981 | Ariyalur | 26.7 | 1012.15 | 0 | High |
| 2 | 1983 | Ariyalur | 26.34 | 1038.2 | 0 | High |
| 3 | 1985 | Ariyalur | 26.8 | 1219.65 | 0 | High |
| 4 | 1986 | Ariyalur | 27.07 | 880.31 | 1 | High |
| 5 | 1987 | Ariyalur | 26.81 | 874.81 | 1 | High |
| 6 | 1988 | Ariyalur | 26.41 | 1347.59 | 0 | Avg |
| . | . | . | ||||
| . | . | . | ||||
| . | . | . | ||||
| . | . | . | ||||
| 664 | 1982 | Virudunagar | 26.7 | 649.08 | 0 | Low |
| 665 | 1991 | Virudunagar | 26.86 | 832.33 | 0 | Low |
| 666 | 1994 | Virudunagar | 26.61 | 790.18 | 1 | High |
| 667 | 1999 | Virudunagar | 26.54 | 779.27 | 1 | Avg |
Table 1. Sample Climatic Data for Districts in Tamil Nadu.
The output of the training step of the classification algorithm CART is a classifier modelled in the form of a decision tree [9]. The modelling and the performance of tree based classifier has been evaluated through the free and open source data mining software ‘R’ Language on the Climatic dataset.
Evaluation
Performance evaluation
Evaluation of the Performance of a classifier decides its accuracy in classifying the new data set. There are various Accuracy and Error rate measuring parameters which are intended for a given set of test tuples (rows or records in a database-the data) in order to delineate the performance and correctness of the classifier obtained in the results. The confusion matrix is one such useful tool used to identify how well a classifier can recognize the tuples of different classes (Table 2 and Figure 2) [16].

Figure 2: Classifier modelled using CART algorithm.
| Average | Low | High | |
|---|---|---|---|
| Average- tuples prediction | TP-211 | TN-10 | TN-18 |
| Low - tuples prediction | FN-21 | FP-200 | FN-07 |
| High - tuples prediction | TN-09 | TN-06 | TP-185 |
Table 2. Confusion Matrix for the given test data.
The confusion matrix is used to verify the performance of the classifier. It is a table generated by testing the classifier over a given set of test data [18]. The matrix constitutes four terms. True Positives (TP): Number of tuples with classes predicted correctly by classifiers. True Negatives (TN): Number of tuples with classes ‘average’ and ‘high’ incorrectly predicted. False positives (FP): Number of tuples with class ‘low’, correctly predicted by the classifier. False Negatives (FN): Number of tuples with class ‘low’, incorrectly predicted.
Results
The performance measures like accuracy, sensitivity and specificity are computed from the confusion matrix for any binary classifier (Table 3 and Figure 3). Accuracy specifies the overall creativeness of the classifier. For the given dataset, the accuracy is measured to be 89%. Sensitivity and Specificity measure the correctness individually with respect to ‘yes’ & ‘no’ classes.

Figure 3: Graph- Confusion Matrix.
| Accuracy Measures | Average | Low | High |
|---|---|---|---|
| Sensitivity | 0.88 | 0.91 | 0.92 |
| Specificity | 0.87 | 0.87 | 0.87 |
| Accuracy | 0.9 | 0.88 | 0.89 |
Table 3. Performance Metrics Measures fort CART classifier.
Error rate of the classifier is measured simply as follows (Table 4 and Figure 4)

Figure 4: Graph-Performance Evaluation.
| Classifier | Error Rate |
|---|---|
| CART | 0.11 |
Table 4. Error rate of the classifier-CART.
Conclusion
In this study, the tree-based classification algorithm CART is applied over the Jatropha seed data for predicting yield. We have conducted experiments on real datasets which include climatic data of various districts of Tamil Nadu. The crop yield management normally reveals a correlation between prediction attributes and results. Among the energy crops, particularly Jatropha seed could add significantly to mitigation of global problems in energy security if high yields can be achieved. This paper addresses the classification and regression problem by developing a binary decision tree for predicting the yield estimation of Jatropha seeds. The validated statistical approach CART allowed to classify the yield of Jatropha into low, average and high. The result of our analysis shows with error rate and significantly higher rates of accuracy. As CART gives high classification speed it facilitates the complete supply chain network planning of Jatropha seeds.
References
- Achten WMJ, Verchot L, Franken YJ, et al. “Jatropha bio-diesel production and use”, Biomass and Bioenergy. 2008;1063-84.
- Afonso AM, Ebell MH, Gonzales R, et al. ‘The use of classification and regression trees to predict the likelihood of seasonal influenza’. Family Practice. 2012;29:671-7.
- Gray B. Classification tree analysis using TARGET. Computational Statistics & Data Analysis. 2008;1362–72.
- Patel BR. A Survey on Decision Tree Algorithm for Classification. Int J Eng Dev Res. 2014;1-10.
- Xiao G, Zhang Q, Li Y, et al. “Impact of temperature increase on the yield of winter wheat at low and high altitudes in semiarid northwestern China”. Agricultural Water Management. 2010;1360-4
- Heller J. “Jatropha curcas L. Promoting the conservation and use of underutilized and neglected crops”, Institute of Plant Genetics and Crop Plant Research, Gatersleben. International Plant Genetic Resources Institute, Rome. 1996.
- Murtagh F, ‘multilayer perceptron for classification and regression’. Neurocomputing. 1991:183-97.
- Forson FK ,Odura EK, Donkoh HE. ‘Performance of Jatropha oil blends in diesel engines’. Renewable Energy. 2004;29:1135-45.
- Kaur J. Description of Genetic and CART Algorithm using Data Mining Tool. Int JAdv Res Comput Sci Software Engi. 2015;948-52 .
- Manian K, krishnan GS. “Physiological basis for ecological preference of Eucalyptus globulusLabill (blue gum)-II Growth and Oil production”. Indian Forester. 1995;300-5.
- Meher LC, Churamni CP, Arif MD, et al. ‘Jatropha curcus a renewable source for biofuel- A review’. Renew Sustain Energy Rev. 2013; 26:397-407.
- Michel WK. Classification and regression trees versus namograms: A bone scan positivity example’. Eur Urol. 2010;57:559-60.
- Ogunleye, AEletta OA. “Nonlinear programming for solvent extraction of Jatropha Curcus seed oil for biodiesel production”. Int J Energy Engi. 2012;2:8-14.
- Thornton PK, Jones, Alagarswamy G. “Adapting to climate change: Agricultural system and household impacts in East Africa”. Agricultural Systems. 2010;103:73-82.
- Sumner ME, Shahandeh H, Bouton J. “Amelioration of an acid soil profile through deep liming and surface application of gypsum”, Soil Science Society American Journal. 1986;50:1254-8.
- Tanagra-Data Mining tutorials http://data-mining- tutorials.
- TANAGRA1.4.48: data mining with open source machine learning software.
- Thamilselvan P. A Comparative Study of Data Mining Algorithms for Image Classification. Int J Edu Manag Engi. 2015;2:1-9.