Research Article - Biomedical Research (2016) Computational Life Sciences and Smarter Technological Advancement
A novel automatic stepwise signal processing based computer aided diagnosis system for epilepsy-seizure detection and classification for EEG
Arjunan Kavitha1* and Vellingiri Krishnaveni21Department of Electronics and communication Engineering, Er Perumal Manimekalai College of Engineering, Anna University, Hosur, India
2Department of Electronics and communication Engineering, PSG College of Technology, Anna University, Coimbatore, India
- *Corresponding Author:
- Arjunan Kavitha
Department of Electronics and communication Engineering, Er Perumal Manimekalai College of Engineering, Anna University, India
Accepted on August 30, 2016
Abstract
Epilepsy is one of the brain based disease affects human due to over electricity power passed in the brain. It is also a neurological disorder problem comes after stroke or brain fever, brain attack or while less blood flow in the brain. Recurrent attack creates epilepsy mainly. Number of death increased nowadays due to epilepsy seizures. In order to control this it is essential to identify and detect the epilepsy seizures from Electroencephalography (EEG) recorded from the patients. Certain number of symptoms led a doctor to suspect epilepsy seizures. One of the most important tools to diagnose neurological problems and epilepsy seizures is by analysing the EEG. Therefore EEG is considered as an indispensable tool for diagnosing epilepsy in medical industry. The occurrence of the epilepsy is irregular and it is difficult to predicting the seizures automatically. Hence, in this paper it is motivated to design and develop a novel approach for detecting and classifying the epilepsy-seizures from EEG signals automatically. The existing research work presents an approximate entropy method and improved approximate entropy method. But the obtained accuracy is very less. In order to improve the accuracy of the classification, this paper aimed to provide a novel approach which comprises of a sequence of signal processing steps such as: filtering, amplifying, decomposing, feature extraction and selection and classification. The experiment is carried out in MATLAB software and the results investigated and evaluated by comparing with the existing system results. The proposed approach obtained 12% of accuracy is improved than the existing approaches.
Keywords
Signal processing, Medical signal processing, EEG, Wavelet transform, Multi-class support vector machines classifier, Epilepsy, Seizure detection.
Introduction
It is clearly known that the entire functions of the body are triggered by message passing system through the human brain. One of the neurological disorder and seizures disorder affecting the human nerve system is called as epilepsy. One of the diseases greatly affects mostly elder people is epileptic seizures. Epileptic seizures are symptoms of abnormal excessive neuron activities in the brain whereas it is also one of neurological disorder categorized by recurrent seizures. Due to sudden surge of electrical activity in the brain causes seizures, that is an excess in the electrical activity in the brain makes seizures. Since it central brain activity cannot be controlled by the normal messaging system among the brain cells and the entire human body. At the time seizure the human brain mixed up with so many activities or it will be halted. The types of the seizures are not same for the epilepsy and it affect the people differently.
The symptoms and signs of the seizures differ according the type [1]. The common type of the seizure is convulsive and it affects the human up to 60% [2]. 75% of this seizure starts as focal seizures and it is converted into generalized seizures whereas 25% of them are start as generalized seizures [3]. The remaining 40% of the seizures are non-convulsive [4]. There are various kinds of epilepsy and two different kinds of epileptic seizures are partial epilepsy and generalized epilepsy. The partial seizures are also called a focal seizures which is occur in only a specific location of the brain, also it affects only a certain portion of the body. The symptoms of the partial seizures are: repeated motions, confusion or staring, changes in the emotion suddenly and dizziness [5]. The generalized seizures occurred in the entire brain where it affects the entire body. The symptoms of the general seizures are consciousness loss, a bite on the tongue, falling down while running speedily and controlling the bladder loss.
Risk Factors and Diagnosis
It is not able to detect the epilepsy for certain people. Than adults detecting and identifying the epilepsy occur in children is too difficult, since the causes are not known. There are certain risk factors which play a vital role in developing epilepsy are: head injury, brain injury, brain tumour, lack of oxygen during the birth, infection in brain and hardening of the arteries of the brain so on. Brain problems are also inheritance in a family, due that epilepsy can also identified from the family history. Centers for Disease Control and Prevention (CDC) organization reported that there are more than two million people are living with epilepsy [6]. In each year more than 1 lake of people are coming with different causes which are presented in the CDC diagnosed report. It is crucial to diagnose accurately but without accurate diagnosis providing an appropriate treatment is too difficult and ineffective. In the beginning stage the symptoms are clarified and confirmed form the figure before going to describe the reasons are due to seizures. If it is identified and confirmed that the symptoms are because of with a seizure, its type and the reason are identified.
In order to diagnose the disease the medical experts will frequently and continuously raise certain questions to the patients to get a medical history. From the answers the doctors can rule out the some of the conditions related epilepsy and proceed for further medical diagnosis to decide about the disease. The doctor concentrates on the conditions of before, during and after a seizure of a person [7]. All the medical diagnosis will start with the complete blood count. If found any infection in the electrolytes or disorders related to kidneys then it will cause the seizures. If any drugs are or poisons in the blood which can cause seizures and it can be seen through a toxicology screening method. Puncture during needle insertion can also make infection. This mostly happens while inserting a needle between certain bones of spinal card. An efficient diagnosis system which helps to test the epilepsy is through EEG (Electroencephalogram). From EECG test the electrical activity of the brain is monitored to detect abnormalities like spike to patterns. To do monitoring the brain activity continuously a video EEG is taken for diagnosing process during and after seizures. MRI and CT are some more screening methodologies which help to identify the brain abnormality in terms of tumour occurrence.
After detecting and identifying epilepsy occurrence, immediately treatment processes are applied. For all the diseases, the treatment and the drugs level of the treatment are followed strictly. Similarly the drugs and its limit are important for epilepsy treatment. Anticonvulsants and anti-epileptics are effective for controlling the seizure for large ratio of the patients. Some of the seizure medications are [7]:
• Mysoline (Primidone)
• Topamax (Topiramate)
• Neurontin (Gabapentin)
• Klonopin (clonazepam)
Some of the medication can make some side effects and risks. So it is essential to take the suitable medication according to the doctor advice. The dosage of each drug should be determined according to the severity of the disease level. Also different dosage level suits for different levels of severity [8]. If the medication don’t respond means it is essential to go for surgery. Since lot of complications in detecting, identifying and classifying the epilepsy seizures, it is essential to monitor and analyse the EEG signals recorded for the patients. The entire contribution of the paper is:
• Load and pre-process the EEG Signal
• Decompose the signal in different levels and fetch the coefficients
• Extract the features and select the features
• Classify the features using multi-class SVM method.
In order to do the above steps involved in the proposed approach initially the EEG signal is filtered and amplified for processing. Filtering is a method for removing the noise and amplification is a method for strengthening the signal where it increases quality of the signal processing process.
Filtering and Amplifying EEG
After acquiring EEG signals, Analog-to-Digital (ADC) circuit converts them into digital form and then the digital filter which is built-in, pre-filters them. The artifacts possessed by the EEG signals which are taken from EEG electrodes. At several points, recording is the only process to responsible and taint the EEG data. There will not be better results in the proceeding operations, when similar artifacts are present. The artifacts which are formed on different factors should be removed. The removal of the outliers is done by pre-processing of signal. This extends to produce the subsequent signal, to cluster the task easier and better [9]. A variety of hospitals record their EEG signals in .eeg format. MATLAB supports the obtained signal data which is converted to excel format primarily. Among the four frequency bands, delta band is chosen for recognition of epileptic disorder [10].
The comparison between the normal and epileptic delta waves is carried out using back propagation algorithm during the training of delta wave. Lastly, epileptic disorder is detected in proportion to the output. Doctors’ use Resource Management Suite (RMS) software to record EEG signal which is up to 100 Hz. Due to small frequency range 60 Hz of signal; it is only useful for diagnosis of Epilepsy. Hence by means of band pass filter we can limit the band signal up to 60 Hz. EEG signal is subjective by various artifacts like 50 Hz line noise, eye blink, eye movement, muscle activity, etc. while recording. Before processing the EEG signal, these artifacts must be removed. 50 Hz line noise is removed by using a notch filter [11]. For decomposing the signal into various frequency bands, the frequency range is to split such as alpha (9-13 Hz), delta (1-3 Hz), theta (4-8 Hz), beta (14-30 Hz) using DWT. Also it is essential to amplify the EEG signal for decomposing and analysing it. The minimum recommended inputs are 25 electrode but the preferred are 32 electrode inputs when recording process takes place. For preventing the loss of data, the system should provide two reference inputs and one reference electrode become dislodged during recording. The input impedance should be greater than 10 mega-ohms. For each input, the common mode rejection ratio should be at least 100 dB. For demonstration of the project we are using only 3 electrodes here.
Wavelet Based Seizure Detection
One of the popular and efficient methods for signal processing in terms of decomposing and feature extraction is waveletdomain methods. Wavelets have been broadly used in the field of EEG signal analysis, particularly for seizure finding and guessing. The wavelet transform is itself regarded as some sort of sub-band decomposition, but with down sampling. Both analog and digital signals can utilize the wavelet transforms. It is important to consider the WT. With Low-Pass (LP) and High-Pass (HP) filtering, the WT can be implemented along with a decimation process, and it must be invertible as shown in Figure 1 [12]. The WT can be implemented with a single level or multi levels as shown in Figures 2 and 3. Only on the low-pass branch, it is possible to decompose the multi-level wavelet up to the required level. An added implementation of wavelet analysis is the wavelet packet transform, which performs further decomposition on the low-pass and high-pass branches.

Figure 1. The two band decomposition-reconstruction filter bank.

Figure 2. Wavelet decomposition and reconstruction. The down arrow is down-sampling by 2, and the up arrow is up-sampling by 2: Multilevel wavelet decomposition tree.

Figure 3. Wavelet decomposition and reconstruction. The down arrow is down-sampling by 2, and the up arrow is up-sampling by 2: Multilevel wavelet reconstruction tree.
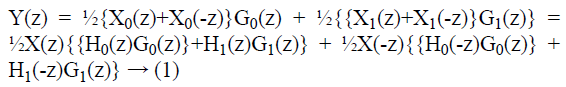
It is a must to satisfy the Perfect Reconstruction (PR) condition when the wavelet decomposition and reconstruction filters H0, H1, G0, and G1 are performed. These filters can be obtained by solving the Equation 1 [12]:
For extracting discriminated features from appropriate subbands to be used for further classification the wavelet analysis for EEG seizure detection and prediction is used.
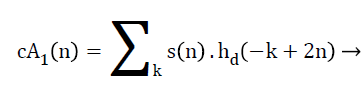
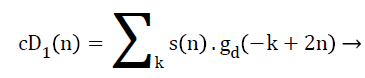
Mostly the DWT evaluation has two stages. The initial stage is the determination of wavelet coefficients hd (n) and gd (n).
These coefficients represent the given signal X (n) in the wavelet domain. From these coefficients, second stage is achieved with the estimate of both the approximated and exhaustive version of the unique signal, these wavelet coefficients are called cA1 (n) and cD1 (n) as defined below in Equations 2 and 3.
 (2)
(2)
 (3)
(3)
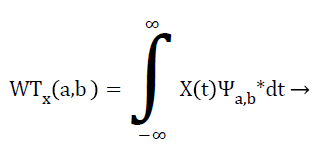
The same process is adapted to estimate cA2 (n) and cD2 (n) connected with level 2 decomposition of the signal and the process goes on. The above algorithm is shown in Figure 2. First of all the original signal X (n) is agreed through a band pass filter which is the grouping of a set of low pass and high pass filter followed by a sub-sampling of two in each phase in unity with Nyquist’s rule to keep away from data redundancy problem. Once all the wavelet coefficients are known the DWT in the time domain can be resolved by reconstructing the equivalent wavelet coefficients at different levels. The modernization algorithm is shown in Figure 3 which is just the undo process of wavelet decomposition. The Wavelet Transform (WT) of a signal X (t) is stated in Equation 4 as
 (4)
(4)
Where 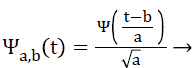 (5) Is a scaled and shifted version
of the mother wavelet Ψ (t). The parameter ‘a’ corresponds to
scale and frequency domain property of Ψ (t). The parameter b
corresponds to time domain property of Ψ (t). In addition 1/√a
is the normalization assessment of Ψa, b (t) for having
spectrum power as same as mother wavelet in each scale. The
DWT is introduced by allowing for sub band decomposition
using the digital filter equivalent to DWT. The filter bank
configuration is shown in Figure 2. The Band pass filters are
implemented as a low pass and high pass filters pair which has
mirrored individuality. While the low pass filter approximates
the signal. The high pass filter provides the information
missing in the approximation. The approximations are low frequency, high scale component, while the details are high
frequency low scale element. Figure 3 shows the additional
simplified diagram of the decomposition algorithm of the
signal X (n) which is decomposed up to level 3 for indicating
how the original signal X (n) is related to the decomposed
version of the same in conditions of approximate and detail
coefficients at every stage. From Figures 2-4, it is clear that
how the DWT decomposition functions of the original signal
and reconstruct the signal back.
(5) Is a scaled and shifted version
of the mother wavelet Ψ (t). The parameter ‘a’ corresponds to
scale and frequency domain property of Ψ (t). The parameter b
corresponds to time domain property of Ψ (t). In addition 1/√a
is the normalization assessment of Ψa, b (t) for having
spectrum power as same as mother wavelet in each scale. The
DWT is introduced by allowing for sub band decomposition
using the digital filter equivalent to DWT. The filter bank
configuration is shown in Figure 2. The Band pass filters are
implemented as a low pass and high pass filters pair which has
mirrored individuality. While the low pass filter approximates
the signal. The high pass filter provides the information
missing in the approximation. The approximations are low frequency, high scale component, while the details are high
frequency low scale element. Figure 3 shows the additional
simplified diagram of the decomposition algorithm of the
signal X (n) which is decomposed up to level 3 for indicating
how the original signal X (n) is related to the decomposed
version of the same in conditions of approximate and detail
coefficients at every stage. From Figures 2-4, it is clear that
how the DWT decomposition functions of the original signal
and reconstruct the signal back.

Figure 4. Unipolar recording EEG.
Wavelet-domain seizure detection
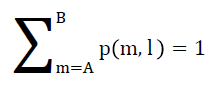
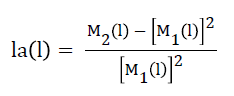
For discriminating between seizure and non-seizure periods is the main challenge in wavelet-based EEG seizure detection. It is also determining the appropriate wavelet decomposition level and the selection of the features from certain sub-bands. Zhou et al. presented a wavelet based seizure detection method that depends on lacunarity and fluctuation index as features with Bayesian Linear Discriminate Analysis (BLDA) [13]. In fractal analysis, the lacunarity, a measure of heterogeneity is used. The EEG epochs are first decomposed into five wavelet sub-bands by the authors in this method. Three sub-bands with scales 3, 4 and 5 are chosen for further processing. For feature extraction, lacunarity and fluctuation index are calculated within the frequency bands. If p (m, l) denotes the probability of points, whose amplitude is identical to m, l represents the length of EEG epochs, A is the minimum amplitude value, and B is the maximum amplitude value, then the equation below holds [13]:
After calculation,
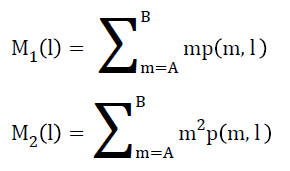
Similarly the lacunarity can be calculated as:
Classification of the seizures is performed after feature extraction, with the help of BLDA. The BLDA tries to lessen the hazard connected with the classification result. It can deal with high dimensionality and noisy datasets, assuming a linear relation between targets t and feature vectors ‘x’ from one side and additive white Gaussian noise ‘n’ from the other side in Bayesian regression. For enhancing the detection accuracy of the BLDA, post-processing such as smoothing, and multichannel decision fusion are applied. The performance of this method was investigated on Freiburg EEG database, and it achieved 96.25% sensitivity with 0.13/h false detection rate. Another five-level wavelet decomposition method for seizure detection was developed by Liu et al. [13]. This method works on multi-channel i EEG signals. Three wavelet sub-bands are selected for further processing.
The relative amplitude, relative energy, coefficient of variation, and fluctuation index are the extracted features from these subbands. The coefficient of difference is the ratio between the standard deviation of a decomposed sub-band and the square of its mean. The fluctuation index is a measure of the strength of a decomposed sub-band. For enhancing the detection performance with smoothing, multi-channel decision fusion and collar processing, an SVM classifier is used in this approach and some sort of post processing is implemented. During the process, the collar processing is a particular technique aiming to maintain the data continuity. The performance of this method has been tested on 509 h for 21 epilepsy patients. Experimental results have shown that this method achieved 94.46% sensitivity, a 95.26% specificity and a 0.58/h false detection rate on long-term intracranial Electroencephalogram (iEEG). Panda et al. adopted the fivelevel wavelet decomposition with an SVM classifier for seizure detection from background EEGs [14]. This classifier wasted on a healthy subject with open eyes, a healthy subject with closed eyes, and an epilepsy patient. The extracted features for signal classification are energy, standard deviation, and entropy. The simulation results revealed an accuracy of 91.2% in seizure activity detection.
With relative energy and Normalized Coefficient of Variation (NCOV) as features [15], Khan et al. proposed a resembling approach, but for seizure detection. It works on wavelet coefficients acquired in the frequency range of 0 to 32 Hz as follows:
The Coefficient of Variation (COV) is calculated using the following formula as:
COV= σ2/μ2
Where σ2 represents the epoch variance μ represents the mean value for epoch. Similarly Relevance Coefficient of Variation (RCOV) is calculated as:
RCOV= COVe (n)/COV (l)
COVe (n) represents the coefficients obtained from epoch variation and COV (l) represents the background coefficients of variation. Finally NCOV is calculated as:
NCOV= σ2/μa
Wavelet-Domain Seizure Prediction
For seizure prediction, the same concepts of wavelet signal analysis can be used for seizure detection, but for this time with the target as the detection of the parietal state. It is common that EEG signals containing seizures are build-up of constantly changing bursting levels. The nature of this signal is to enable the discrimination between different signal activities from wavelet sub-bands.
The Residual Sub-band Wavelet Entropy (RSWE) can be directly used to estimate the entropy of bursts from the subbands as proposed by Paul et al. [16]. The wavelet decomposition equation for an EEG signal using a sliding window of index m is given by: Equation 6
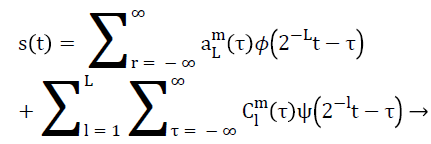 (6)
(6)
Where, 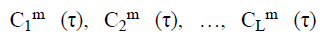 are the wavelet
coefficients. The aL m (τ) sequence is the coarse-resolution
signal for a high-level decomposition. From these values the
optimum values are selected in each level. Also the Relative
Wavelet Energy (RWE) is used to get the sub-band based
wavelet entropy features. The sliding window for the index m,
the Potential Field (FP) can be represented as [17]:
are the wavelet
coefficients. The aL m (τ) sequence is the coarse-resolution
signal for a high-level decomposition. From these values the
optimum values are selected in each level. Also the Relative
Wavelet Energy (RWE) is used to get the sub-band based
wavelet entropy features. The sliding window for the index m,
the Potential Field (FP) can be represented as [17]:
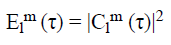
And the corresponding wavelet coefficients’ total energy can be written as:
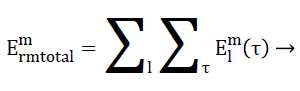 (7)
(7)
Dataset
In this paper there are 5 number of patients’ EEG is recorded in the scalp and the data is collected from Madras University Medical College Hospital. Unipolar and bi-polar records were collected and analysed in this paper and it is shown in Figures 4 and 5 respectively. In unipolar EEG signals the intensity is different by normalizing the channels in terms of background. It leads to get seizure-free state in the EEG and only in unipolar detecting seizures is fast and efficient. But in the bipolar the data consists of spatial information leads to detect focal epileptic disorders. Since, the EEG can be classified easily into normal EEG, focal disorder, and generous disorder from the dataset taken. Also in this paper the experimental data are pre-processed to eliminate the artifacts. The EEG signals were digitally filtered by a band pass filter (0.1-70 Hz), a notch filter (60 Hz), and a Daubechies 4 wavelet filter (supported by MATLAB).
Feature Extraction and Feature Selection
In order to detect and classify the seizures in EEG signal the approximation entropy method is applied to extract the features. This method extracts the rhythms accurately from the EEG signals. From the experiment it is decided and concluded that the approximation entropy method is best method for feature extraction in EEG. There are some of the important parameters are considered here to fetch the features such as:
N: is length
m: is sample window length (2 to 5)
r: is threshold value representing the noise level in the filter (0.1 to 0.9).
Where d (a, b) is an operator which denotes the distance between a and b. The approximate entropy is obtained from
APEn= m (r)-m+1 (r)
The experimented unipolar and bipolar EEG signals are shown in the following Figures 4 and 5 respectively.

Figure 5. Bipolar recording EEG.
Including the entropy some of the statistical features are extracted from unipolar and bipolar EEG signals to classify the seizures. They are:
Total variation:
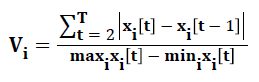
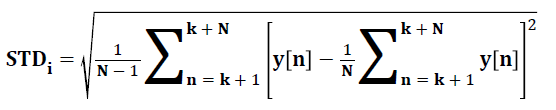
Standard deviation:
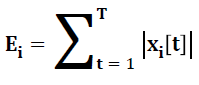
Energy:
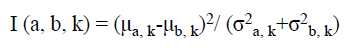
Including the approximation entropy and statistical features there are 64 features are calculated in each channel. In includes sum, max, min, avg and etc. But in this paper there are few features only selected for detecting and classifying the epilepsy seizures in EEG signals. From the above equation, the importance of the particular feature (k) is evaluated for a hyper plane Ωa, b where a and b denotes two different classes. For example, in σa, k, it is clear that the standard deviation of the feature k under the class a is given. The above equation focused to evaluate all the features to determine the capabilities of the various classes and various features of the same class.
Classification Using Multi-Class SVM
Support Vector Machines (SVM) was initially intended for twofold arrangement. Step by step instructions to successfully broaden it for multi-class arrangement are still an on-going examination issue. A few strategies have been proposed where ordinarily we develop a multi-class classifier by consolidating a few twofold classifiers. Some creators likewise proposed strategies that consider all classes without a moment's delay. As it is computationally more costly to illuminate multiclass issues, correlations of these techniques utilizing substantial scale issues have not been genuinely led. Particularly for strategies settling multi-class SVM in one stage, a much bigger advancement issue is required so up to now tests are restricted to little information sets [18].
SVM and multi-class SVM are belongs to machine learning approaches, it is able to learn any kind of data by itself without any external technical supports. Both approaches has in-built mechanisms to verify the similarities, distance and matching score among two different objects such as trained object and test object.
The primary function of SVM finds the optimal hyper plane and it is used for classifying the data which is shown in Figure 6. The figure shows that the optimal has two different margins representing two different classes such as {-1} and {1}. The circles sitting on the hyper plane shows that it is the highest optimum value achieved by the SVM and it is the highest classification accuracy. SVM classifier classifies the data linearly as:

Figure 6. Support vector machine/optimal hyper plane.
Where, w is the weight of x, and || wk ||2 is 1, gk (x) gives the Euclidean distance from x to the feature boundary fk. SVM minimizes the mean square error over the sample data among the normalized data and the target data lies between y {-1, +1}. -1 and +1 are the two different classes separated from the original dataset. But the multi-class SVM classifies the data under various classes required by the user.
The above Figures 6 and 7 illustrated the classification by SVM and multi-class SVM. SVM classifies the entire data in to two different classes as -1 and +1. But the multi-class SVM classifier classifies the entire data into various classes according to the user defined classes like {-1, 0, +1...}. Multi SVM classifier classifies the data linearly as:

Figure 7. Multi class SVM.
fk: Xd → {-1, 0, +1,....}
Due to various classes available in the input data, here multiclass SVM is applied for classification. In this paper, the multiclass SVM compares the input features and the available trained features in a high dimension using a linear classification methodology. The entire dataset is divided into trained dataset and test dataset then they are feed into multiclass SVM where it determines the optimal hyper plane for classification by reducing the risk. Initially it aimed to compare the labelled classes (a, b) with a weight value over the features in the input/output domain.
Experimental Results and Discussion
In this paper there are 200 dataset is taken for experiment. From the experiment the epilepsy seizure is detected and classified using wavelet method and multi-class SVM method respectively. The obtained results the efficacy of the proposed approach is evaluated by calculating the sensitivity, specificity and accuracy.
The proposed epilepsy detection method is implemented in MATLAB software. There are 5 levels of wavelet decomposition is applied to for extracting the features of the signals. For testing and training performance including the collected data set, some more data is taken from the dataset used in [19,20]. The entire data set is grouped into various cases under various subjects like male, female etc. All the signals were sampled more than 200 samples per second with 24 bit resolution.
Specificity: Number of correctly detected negative patterns/ total number of actual negative patterns. A negative pattern indicates a detected normal/non-seizure.
Specificity= TN/ (FP+TN)
Sensitivity: Number of correctly detected positive patterns/ total number of actual positive patterns. A positive pattern indicates a detected seizure.
Sensitivity= TP/ (TP+FN)
Accuracy: Number of correctly classified patterns/total number of patterns. Then the determined values are tabulated and it is shown in the Table 1 below.
| Parameter | Number | IApE method [21] | ANN method [22] | Proposed method |
|---|---|---|---|---|
| Sensitivity | 1 | 0.75 | 0.78 | 0.83 |
| 2 | 0.5 | 0.54 | 0.64 | |
| 3 | 0.5 | 0.59 | 0.67 | |
| 4 | 0.24 | 0.73 | 0.79 | |
| 5 | 0.42 | 0.78 | 0.82 | |
| Specificity | 1 | 0.55 | 0.88 | 0.91 |
| 2 | 0.5 | 0.7 | 0.92 | |
| 3 | 0.5 | 0.56 | 0.89 | |
| 4 | 0.45 | 0.72 | 0.88 | |
| 5 | 0.44 | 0.88 | 0.88 | |
| Accuracy | 1 | 0.58 | 0.83 | 0.87 |
| 2 | 0.51 | 0.56 | 0.86 | |
| 3 | 0.5 | 0.57 | 0.87 | |
| 4 | 0.42 | 0.73 | 0.81 | |
| 5 | 0.43 | 0.83 | 0.89 | |
| IApE: Improved Approximate Entropy; ANN: Artificial Neural Network | ||||
Table 1. Performance evaluation.
Accuracy= (TP+TN)/ (TP+FP+TN+FN)
From the experiment the obtained sensitivity, specificity and accuracy are given in Table 1 along with the obtained values from the existing approaches.
The comparison of sensitivity, specificity and accuracy of the proposed wavelet method compared with the existing IApE method and Approximation Entropy (ApE) method is shown in the above Figure 8. From the Figure 8 and the Table 1 it is clear that the obtained sensitivity, specificity and accuracy using the proposed method are far better than the existing approaches [21,22].

Figure 8. Performance evaluation.
Conclusion
This paper is focused to detect and classify the epilepsy seizures in EEG signals according to the features extracted. In order to do this the EEG signals are collected manually and from internet (existing research work) and a stepwise signal processing steps are applied. To improve the feasibility of the detection and classification the EEG signals are decomposed into more number of levels (5 levels) and classify the features under various classes. All the signals are pre-processed, filtered, decomposed and feature extracted and finally classified using filters, wavelet transformation, approximation entropy method and multi-class SVM method respectively. One of the major advantages of this proposed approach is 10 scales are used for computing wavelet of the signals. Finally to obtain the accurate classification multi-class SVM classifier is used. From the experimental results it is clear and proved that the proposed approach is better than the existing approaches and it is decided that this method is suitable for EEG-epilepsy seizure detection.
References
- Shearer P, Riviello J. Generalized convulsive status epilepticus in adults and children: treatment guidelines and protocols. Emerg Med Clin North Am 2011; 29: 51-64.
- National Institute for Health and Clinical Excellence. The epilepsies: The diagnosis and management of the epilepsies in adults and children in primary and secondary care. Nat Clin Guideline Centre 2012; 21-28.
- Hughes JR. Absence seizures: a review of recent reports with new concepts. Epilepsy Behav 2009; 15: 404-412.
- About epilepsy: The basics. Epilepsy Found 2014.
- Epilepsy. Cedars Sinai Edu 2014.
- Epilepsy: Frequently asked questions. CDC Gov 2013.
- Seizure and epilepsy medicines. Epilepsy Found 2014.
- Seizure medication list. Epilepsy Found 2014.
- Priyanka K, Archana T. A survey on different noise removal techniques of EEG signals. Int J Adv Res Comp Commun 2013; 2: 1091-1095.
- Sadhish Kumar ST, Kasthuri N. Determination of epileptic disorder with discrete wavelet: transforms and neural network classifier. J Comp 2014; 10: 66-72.
- Shooshtari P, Gelareh M, Behnam MA, Mohammad BS. Removing ocular artifacts from EEG signals using adaptive filtering and ARMAX modelling. Proc World Acad Sci Eng Technol 2006; 11: 277-280.
- Liu Y, Zhou W, Yuan Q, Chen S. Automatic seizure detection using wavelet transform and SVM in long-term intracranial EEG. IEEE Trans Neural Syst Rehabil Eng 2012; 20: 749-755.
- Zhou W, Liu Y, Yuan Q, Li X. Epileptic seizure detection using lacunarity and Bayesian linear discriminant analysis in intracranial EEG. IEEE Trans Biomed Eng2013; 60: 3375-3381.
- Panda R, Khobragade PS, Jambhule PD, Jengthe SN, Pal PR, Gandhi TK. Classification of EEG signal using wavelet transform and support vector machine for epileptic seizure diction. Proc Int Conf Sys Med Biol 2010; 405-408.
- Khan YU, Rafiuddin N, Farooq O. Automated seizure detection in scalp EEG using multiple wavelet scales. Proc IEEE IntConf Sig Proc Comp Contr 2012; 15-17.
- Paul JS, Patel CB, Al-Nashash H, Zhang N, Ziai WC, Mirski MA, Sherman DL. Prediction of PTZ-induced seizures using wavelet-based residual entropy of cortical and subcortical field potentials. IEEE Trans Biomed Eng2003; 50: 640-648.
- Hung SH, Chao CF, Wang SK, Lin BS, Lin CT. VLSI implementation for epileptic seizure prediction system based on wavelet and chaos theory. Proc IEEE Tencon 2010; 21-24.
- Hsu CW, Lin CJ. A comparison of methods for multiclass support vector machines. IEEE Trans Neural Netw 2002; 13: 415-425.
- Ali S, John G. Application of machine learning to epileptic seizure detection. Proc Int Conf Mach Learn Israel Omni press 2010.
- Goldberger AL, Amaral LAN, Glass L, Hausdorff JM, Ivanov PCH, Mark RG, Mietus JE, Moody GB, Peng CK, Stanley HE. Physio bank, Physio Tool kit, and Physio Net: Components of a new research resource for complex physiologic signals. Circulation 2000: 101: e215-e220
- Espie CA, Watkins J, Curtice L, Espie A. Psychopathology in people with epilepsy and intellectual disability; an investigation of potential explanatory variables. J Neurol Neurosurg Psychiatry 2003; 74: 1485-1492.
- Reddy S, Kulkarni PK. EEG signal classification for epilepsy seizure detection using improved approximate entropy. Int J Publ H Sci 2016; 2: 23-32.