Research Article - Biomedical Research (2018) Volume 29, Issue 14
A new hybrid filtering technique for minimization of over-filtering issues in ultrasound images
Sumit Kushwaha* and Rabindra Kumar SinghElectronics Engineering Department, Kamla Nehru Institute of Technology, Sultanpur, India
- *Corresponding Author:
- Sumit Kushwaha
Electronics Engineering Department
Kamla Nehru Institute of Technology, India
Accepted date: June 21, 2018
DOI: 10.4066/biomedicalresearch.29-18-762
Visit for more related articles at Biomedical ResearchAbstract
Image denoising has become a crucial task in medical Ultrasound (US) imaging due to the presence of speckle or multiplicative noise and additive Gaussian noise. Recently, there are several denoising techniques such as AWT+JB Filter, AFSWM Filter, MPBLOW Filter have been proposed to remove the speckle noise. However, these denoising techniques were found to remove noise along with essential parts of the actual image data which is referred as over-filtering. Thereby, it reduces the accuracy of the recognition process. In this paper, a new hybrid filter technique is proposed by combining Anisotropic Diffusion (AD) with Butterworth band pass filter to overcome the over-filtering of the image. In addition, the performance of the proposed hybrid filter and its design parameters are enhanced by using Particle Swarm Optimization (PSO) algorithm. The simulation results show that the proposed filtering technique achieves a better denoising performance on comparisons with other filtering techniques in terms of PSNR, SNR, SSIM, and EPI. Moreover, the results validate that the proposed filtering technique using PSO achieves effective performance than using Harmony Search Algorithm (HSA) and other filtering techniques.
Keywords
US imaging, Anisotropic diffusion, Butterworth band pass filter, PSO, HAS.
Introduction
Recently, medical Ultrasound (US) imaging has been widely used for disease diagnostic applications due to its low cost, non-invasive nature, safety, portability and real-time capability [1,2]. There are several diseases diagnostic of human organs such as chest, kidney, prostate, neck, breast, heart, coronary arterial, abdominal cavity and scrotum [3]. However, the images generated from ultrasound imaging are of relatively low quality due to the presence of speckle noise or multiplicative noise which instigates granular effect on the image [4]. Besides that, the speckle noise and the random additive Gaussian noise are also present in the US images. The existence of these types of noises interrupts the clinical diagnosis accuracy by degrading its visual quality. Furthermore, the diagnosis consuming more time and postprocessing such as segmentation and feature extraction becomes very difficult [5]. Therefore, noise reduction or denoising of US images becomes an essential requirement without the effect of edges and textures in the images.
Various filtering techniques have been proposed to reduce the speckle noise in the ultrasound image. Coupe et al. [6] proposed a speckle reduction technique based on the Non- Local Mean Filtering (NLMF) techniques for US images. This method preserves the structural and edges details of the image accurately. Yang et al. [7] presented a hybrid filtering technique by combining the local statistics with NLMF filtering to reduce the speckle noise. This hybrid method outperforms the original NLM filtering. To further improve the NLMF, Kolmogorov-Smirnov Non-Local Mean (KS-NLM) is proposed [8]. The major advantages of this method are the pixel-wise working capability, eliminating the ghost effect. The main advantage of the approach is the possibility of working pixel-wise, removing the ghost effect and artifact that affects the images filtered by other NLM approaches. Zhang et al. [9] proposed multi-direction median filtering based US image despeckling which preserves the contour and the texture areas that lead to increases visual effects. Kazubek [10] proposed wiener filter for reducing the noise in the images.
An adaptive bilateral filtering for reducing the speckle noise in medical US images are proposed [11,12]. This filtering technique improves the visual quality of US images by removing speckle noise while preserving the diagnostically important image details. Wavelet thresholding-based bilateral filtering is proposed for despeckling of US images [13,14]. The integration of bilateral filtering and NeighShrink preserve edges and remove noises. So, the despeckling performance is not fully contributed through bilateral filtering. Yu et al. [15] and Yu et al. [16] proposed Speckle Reducing Anisotropic Diffusion (SRAD) filter for US images which contains a noisebased instantaneous coefficient of variation. Krissian et al. [17] proposed Oriented SRAD (OSRAG) filter which considers the local directional variance of the pixel intensity. Bini and Bhat [18] proposed an anisotropic level set diffusion for despeckling of low SNR and low contrast US images.
Most of the noise filtering techniques performs well in terms of preserving the edges and texture of the US images by reducing the multiplicative noise. In the despeckling of images, some of the data is lost in the image which is important to improve the visual quality. This is called over-filtering of the noise image. To overcome this over-filtering issue, Guleryuz [19] proposed a filtering algorithm based on threshold selection technique which limits the noise over-filtering.
In this paper, a hybrid despeckling technique is proposed based on anisotropic diffusion and Butterworth Band Pass filter to remove the over-filtering. In addition, Particle Swarm Optimization (PSO) is applied to optimize the design parameters of anisotropic diffusion filter. Therefore, this research employs Butterworth band pass filtering, Anisotropic Diffusion and PSO for denoising and eliminating the overfiltering problem in US images. This paper is organized as follows. Section 2 discusses related works. Section 3 presents the proposed methodology. In Section 4, simulation results are discussed and compared with the other existing techniques. Finally, section 5 concludes the paper.
Related Research
Gupta et al. [20] proposed a speckle reduction filtering algorithm by integrating the modified adaptive non-linear diffusion with thresholding technique. This filtering is also used to reduce both the additive Gaussian and multiplicative speckle noise. Besides, the Non-Subsampled Shearlet Transform (NSST) is used which provides both the multi-scale and direction analysis of the noisy image. The large-amplitude noise elements are suppressed by employing the modified diffusion model based on approximation coefficients and thresholding techniques. It provides the modified coefficients which improve the denoising efficiency with better edge preservation. The simulation results demonstrated that the modified speckle filtering algorithm provides better performance with more edge preservation.
Chithra et al. [21] presented a Dual-Tree Complex Wavelet Transform (DT-CWT) based speckle removal algorithm that is Levy Shrink algorithm for US images. The DT-CWT coefficients of each sub-band are modeled using a large-tailed Levy distribution. Then, the Bayesian Maximum-a-Posteriori (MAP) estimator is applied to compute the uncontaminated DT-CWT coefficients. The performance evaluation of the Levy Shrink algorithm is developed under various performance measures on both quantitatively and qualitatively. Experimental results verified that the efficiency of the Levy Shrink algorithm in both denoising and edge preservation performance.
Babu et al. [22] proposed a non-subsampled contourlet transform based despeckling algorithm. This transform contains the characteristics of high directionality, anisotropy and translation invariance which is controlled by nonsubsampled filter banks. Therefore, it reduces the speckle noise with edges, contours and textures preservation of US images using adaptive binary morphological operations. In morphological operations, the structural elements play an important role in the image enhancement stage. Furthermore, various shapes of structural elements are analysed for different filtering parameters. Experimental results demonstrate that the despeckling algorithm achieves the efficient noise removing performance by preserving the edges and image architectural details.
Fu et al. [23] proposed a hybrid speckle noise reduction technique by integrating the quantum inspired bilateral filtering and wavelet thresholding in medical ultrasound images. Initially, an adaptive bilateral filter is implemented based on quantum signal processing method and it is produced the prefiltered image. Then, the signal and noise coefficients are considered in the wavelet domain and it depends on generalized Laplace distribution and Gaussian distribution. The experimental results show that the quantum inspired bilateral filtering and wavelet thresholding method achieved the better speckle noise reduction performance by preserving highcontrast features like edges and architectural details.
Kang et al. [24] proposed a Feature-Enhanced Speckle Reduction (FESR) algorithm and feature improvement filtering for enhancing the ultrasound B-mode imaging. The objective was to separate the useful features from noise using multi-scale and synthesis technique. Then, the predicted noise is eliminated using anisotropic diffusion filtering, and the extracted features are highlighted using appropriate edge, and contrast enhancement method from fine to coarse scales. Furthermore, the optimization problem is proficiently tackled by the Augmented Lagrangian Multiplier (ALM) iteration in Neutrosophic (NS) domain. Simulation results illustrated that the better denoising performance with edge preservation on both synthetic and real US images. Therefore, the denoising algorithm provides the robust visual improvement of real US images for further operations such as segmentation and object recognition.
Gai et al. [25] presented a novel despeckling algorithm by applying Monogenic Wavelet Transform (MWT) and Bayesian algorithm for the medical US images. The monogenic coefficients are obtained by adding the speckle noise element and noise-free element using Rayleigh distribution and Laplace mixture distribution respectively. Then, the Bayesian Minimum Mean Square Error (MMSE) estimator was derived for the speckle noise reduction. At last, based on the Expectation Maximization (EM) algorithm, the despeckling parameters were computed for both synthetic and real-time medical US images. The simulation results outperform the other algorithm.
Baselice et al. [26] proposed an enhanced Wiener filter for reducing the speckle noise in real US images. The filtering is attained in the frequency domain which is considered by high computational efficiency. The enhanced Wiener filter is capable of locally adapts itself by changing its kernel to integrate edges and details preservation with effective despeckling compared to traditional Wiener filter. This is attained by applying a Local Gaussian Markov Random Field for US images. The simulation results demonstrate that the better denoising performance with the details preservation [27].
Ambrosanio et al. [8] proposed a denoising technique based on the modified Non-Local Mean Filter (NLMF) for the real US images. The main concept of this technique contains the adopted similarity metric which is using statistical distance instead of Euclidean distance. Furthermore, the Kolmogorov- Smirnov distance between the cumulative distribution functions of the pixels is evaluated. Also, the comparative analysis is obtained using Optimized Bayesian Non-Local Means (OBNLM) and SRAD despeckling algorithms. The simulation results confirm the efficient performance of the modified NLMF in terms of good details preservation with effective speckle noise reduction.
Proposed Methodology
An accurate statistical scheme is required for effective speckle reduction of medical ultrasound images. In general, the speckle imaging model is expressed as,

Where, I (x, y) is the noisy pixel of the US image, f (x, y) denotes the noise-free or actual pixel of the image, s (x, y) is the speckle or multiplicative noise, g (x, y) represents the additive Gaussian noise and (x, y) represents the spatial locations in the two-dimensional (2D) US image.
There are various techniques have been proposed for the reduction of speckle in US image. From this technique, a large number of ultrasound images are attained from different directions and several transducer frequencies. Then, the acquired images are averaged to generate a composite image. In this, the compounding technique enhances the object detectability and also it degrades the spatial resolution and reduces the complexity of the system. Therefore, the filtering techniques are considered as more essential in image processing. Also, several denoising techniques are highly filtered the image that losses the essential details such as edges and structural details which leads to creating the complexity of segmentation and prediction process. In this paper, an Anisotropic Diffusion (AD) filtering with Butterworth band pass filtering based hybrid filtering is proposed. Besides, Particle Swarm Optimization (PSO) is used to optimize the design parameter of the hybrid filtering.
Anisotropic diffusion (AD)
The diffusion is a physical procedure that balances the variances of concentration which is defined by Fick’s first law. In the image processing, the intensity of the image is considered as a concentration and the noise is considered as minute concentration in homogeneities. These homogeneities are smoothed by the process of diffusion. Fick’s law for the diffusion is expressed as,
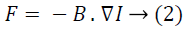
Where, F is the flux initiated by the negative concentration gradient − ∇I (the negative sign denotes that the flux is positive when the movement of the gradient is downward) and B denotes the diffusion tensor. The continuity equation defining the intensity level change with respect to time is given as, 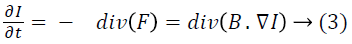
Diffusion filters are used to eliminate the noise from noisy image by adapting the image through solving a Partial Differential Equation (PDE). The diffusion is isotropic, when the diffusion tensor B is a constant over the entire image. The diffusion filter adapts the image by solving the PDE with an initial condition given below,
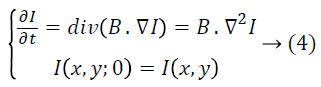
Where, I (x, y) is the actual noisy image, ∇2 denotes the Laplacian operator and t denotes the time parameter. The solution of the Equation 4 produces I (x, y; t) which is the filtered image at time t. Though, the isotropic diffusion filter is reducing the noise in the image continuously. But, it is also produces the blur features such as edges, creating edges harder to identify.Perona and Malik [28] improved the traditional isotropic diffusion equation defined Equation 3 by incorporating a function 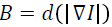 that smoothest the image while attempting to preserve the intensity discontinuities through edges. The different function
  is a monotonically decreasing function known as diffusion coefficient and anisotropic. To attain this properties, desires to fulfil the below conditions,
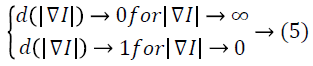
Perona and Malik derived the two functions for expressed as,
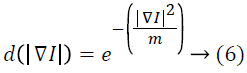
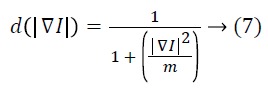
Where, m is the edge magnitude parameter which is also called as smoothing parameter. The diffusion amount is controlled by the parameter m and it ranges from 20 to 100.
If the parameter m is large, there are no intensity gradient obstacles, and hence, the impact on diffusion due to the gradients is minimized.
If the parameter m is low on the contrary, then the diffusion is obstructed by the small intensity gradients. The diffusion coefficient in Equation 6 helps high-contrast edges over lowcontrast ones and the diffusion coefficient in Equation 7 helps wide regions over smaller ones.
PDE of the anisotropic diffusion filter is used to adapt the noisy image is expressed as,
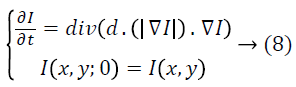
Therefore, the anisotropic diffusion filter is an effective nonlinear technique for instantaneously carrying out the contrast enrichment and the reduction of noise. It conserves the edges by permitting diffusion parallel to the edges. However, AD filtering process removes the noise with some essential part of the image data namely over filtering. Hence, Butterworth band pass filter is used to mitigate the over filtering.
Butterworth band pass filter
Prior to denoising the signals, Butterworth BPF filtering is performed in order to remove the over-filtering [29]. In this case, pre-processing is done using Butterworth Band Pass filter as it has a linear response relatively to other techniques. Similar to other filtering techniques that comprise of nonmonotonic ripple in the passband or stopband, the bandpass filters comprise of a monotonically varying magnitude function with ω. Butterworth filter has a measured roll off relatively. By applying a specific stopband condition, it will entail a higher order. The Butterworth low-pass filter offers utmost passband flatness. Therefore, a Butterworth low-pass is frequently employed as an anti-aliasing filter in data conversion, in this case conversion of the Fourier image to a filtered image, wherein accuracy of the image is essential through the whole passband. Fourier image refers to the image in frequency domain as the Fourier transform converts the image from spatial domain to frequency domain. This Butterworth Band Pass filter is derived mathematically by multiplying the transfer functions of a low and high pass filter. In this, low pass filter contains higher cut-off frequency.
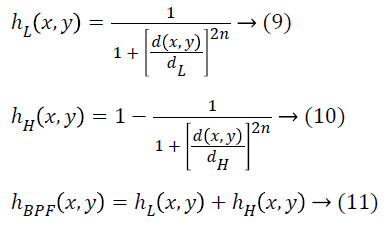
Where, d (x, y) is the distance from origin, n is the order of the filter, dL is the cut-off frequency of LPF and dH is the cut-off frequency of HPF. The upper cut-off frequency taken here is 105 Hz, and the lower cut-off frequency is kept at 50 Hz. For calculating these values, experimentation was done, where different frequencies such as 50, 100, 150, 200 were tried, so as to check the ideal frequency which is suitable to the filtering. If a smaller range is selected, then the filtering is less and improper, and with high range, over-filtering, occurs. Therefore, an ideal range of 50-105 Hz is selected. The Butterworth filter has a smooth transfer function without any discontinuity. The range of frequencies that the filter permits is largely dependent on the order of the filter. In the selection of n, there is cooperation between the demands of the frequency domain and the spatial domain. 2nd order (n=2) is taken here, as band pass filters have two capacitors at low and high pass circuit, and are also referred as two pass filters. Therefore, 2nd order is an ideal choice here. Moreover, Particle Swarm Optimization (PSO) algorithm is employed in order to improve the performance of the hybrid filter by optimizing the design parameter.
Particle swarm optimization (PSO)
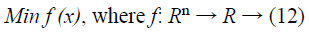
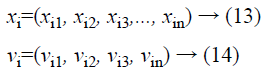
Kennedy and Eberhart [30] introduced the Particle Swarm Optimization (PSO) algorithm which is an exploratory universal optimization technique. The algorithm originates from the bird and fish flock movement behaviour and is extensively utilized and quickly improved for the effortless application and necessitates fewer number of particles to be altered [31]. The co-ordinate of every particle signifies a potential answer connected with two vectors such as the position vector and the velocity vector. Consider the objective function of n-dimensional optimization problem given as,
The proposed hybrid filter optimization problem is considered as the initial stage followed by filter structure. The random initial positions and velocities in PSO are initialized with the different function of hybrid filter structure. Consistent with every practical answer, the position vector and velocity vector are expressed by,
A swarm comprises of numerous particles which are contemplated to be the practical solutions that progress through the search space to obtain the ideal solution. All the particles must appraise their location on the basis of self-exploration, overall optimum swarm exploration and its earlier velocity vector consistent with the subsequent equations:
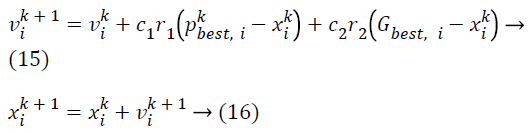
Where, c1 and c2 are two positive constants called acceleration coefficients (learning factors), r1 and r2 are random numbers, uniformly distributed in (0, 1). xi=(xi1, xi2, xi3, ... , xin) is the present location of the ith particle.
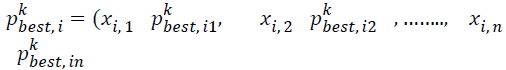 is the position of the ith particle attained on the basis of its own experience.
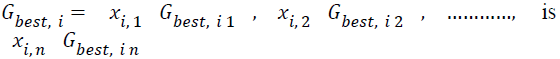
the location of the optimum particle on the basis of the overall swarms experience and k is the iteration counter.
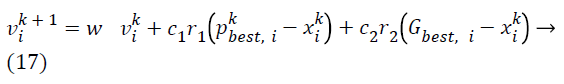
A constant, maximum velocity (Vmax) is used to randomly restrain the velocities of the particle and advance the resolution of the search. However, to improve the exploration process, it is required to decrease the position of Vmax, and conceivably remove it completely, and an addition of an inertia weight w is done. The subsequent velocity update equation is expressed as [32],
PSO optimizes the anisotropic diffusion in order to optimizing the design parameter of the proposed hybrid filter.
Results and Discussion
For the purpose of this study, input data comprising liver ultrasound image data sets is obtained from medical database available on the internet [33]. This data set is fed into the MATLAB platform and the original images of 8 ultrasounds of the liver of different patients are shown in Figure 1.

Figure 1: Original ultrasound images.
Qualitative as well as quantitative methods have been deployed to evaluate the denoising abilities of the proposed method. Performance measurement parameters such as Peak Signal to Noise Ratio (PSNR), Signal to Noise Ratio (SNR) is used to measure speckle noise suppression capability and quantitative evaluation parameters such as Structural Similarity Index (SSIM), Edge Preservation Index (EPI) is used for performance evaluation.
Standard mathematical model is used in PSNR analysis to obtain objective difference amongst two images. The estimation of noise suppression ratio in reconstructed image with original image is calculated through the equation given by,
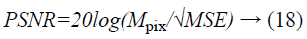
Where, MPix: Maximum pixel value of image; MSE: Mean Square Error.
SNR is used to quantify the noise suppression quality in despeckled image. The SNR ratio is given by,
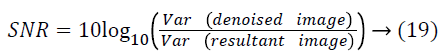
Better denoising capacity is obtained with higher values of SNR.
The structural and perceptual relation amongst original and filtered image is calculated through SSIM index. The equation used for evaluating SSIM is given by,
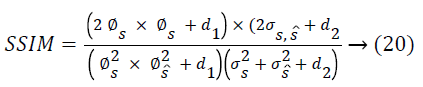
Where, d1 = C1 × L2, d2 = C2 × L2, 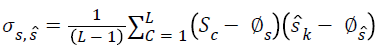 is the co-variance parameter in moving window. The term s defines original image and and s^ defines reconstructed image. ϕ and σ defines mean and variance of the image.
The capability of edge preservation in despeckling image is calculated through edge preservation index and it is given by,
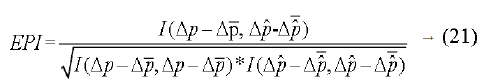
Where high pass filtered version of s and s^ is represented through Δp and Δp^.
After the application of the proposed methodology with Adaptive Wavelet Thresholding and Joint Bilateral (AWT+JB) Filter [36,37], Adaptive Fuzzy Switching Weighted Mean (AFSWM) filter [34], and Median Patch-Based Locally Optimal Wiener (MPBLOW) filter [35], the output filtered images are obtained as shown in Figures 2 to 5.

Figure 2: Proposed method output images.

Figure 3: AWT+JB output images.

Figure 4: AFSWM filter output images.

Figure 5: MPBLOW filter output images.
Further, the denoised output images obtained from above mentioned filters are optimized with PSO and HSA [33] optimization technique which output images are shown from Figures 6 to 13.

Figure 6: Proposed method with PSO output images.

Figure 7: AWT+JB filter with PSO output images.

Figure 8: AFSWM Filter with PSO output images.

Figure 9: MPBLOW filter with PSO output images.

Figure 10: Proposed method with HSA output images.

Figure 11: AWT+JB filter with HSA output images.

Figure 12: AFSWM filter with HAS output images.

Figure 13: MPBLOW filter with HSA output images.
As realized from the above images, it is evident that denoising is efficiently carried out with better optimization. The experimental evaluation is carried out with and without PSO for optimization and denoising performance for individual ultrasound image. The comparative analysis on the basis of PSNR, SNR, SSIM and EPI results for the proposed method with conventional techniques: AWT+JB Filter, AFSWM Filter, MPBLOW Filter for 8 ultrasound images is calculated through MATLAB and the same is shown from Tables 1 to 4.
| Sl. no | Proposed method | AWT+JB filter | AFSWM filter | MPBLOW filter | ||||||||
|---|---|---|---|---|---|---|---|---|---|---|---|---|
| Without optimization | With PSO | With HSA | Without optimization | With PSO | With HSA | Without optimization | With PSO | With HSA | Without optimization | With PSO | With HSA | |
| Image 1 | 28.56 | 36.68 | 29.93 | 33.12 | 34.07 | 33.98 | 29.52 | 34.17 | 30.96 | 29.47 | 35.47 | 32.63 |
| Image 2 | 28.4759 | 35.32 | 31.48 | 32.75 | 33.75 | 33.66 | 29.18 | 33.45 | 30.63 | 29.23 | 34.77 | 32.16 |
| Image 3 | 28.5621 | 36.68 | 32.26 | 33.12 | 34.07 | 33.91 | 29.52 | 34.17 | 30.96 | 29.47 | 35.47 | 32.63 |
| Image 4 | 28.4758 | 35.32 | 31.48 | 32.75 | 33.75 | 33.66 | 29.18 | 33.46 | 30.63 | 29.23 | 34.78 | 32.16 |
| Image 5 | 27.0073 | 34.49 | 28.24 | 31.46 | 32.52 | 32.45 | 28.05 | 32.11 | 29.43 | 28.34 | 33.91 | 31.34 |
| Image 6 | 28.6456 | 36.97 | 32.55 | 33.27 | 34.32 | 34.22 | 29.54 | 34.27 | 30.97 | 29.69 | 35.78 | 32.82 |
| Image 7 | 29.1683 | 36.62 | 30.39 | 33.37 | 34.29 | 34.21 | 30.11 | 34.31 | 31.61 | 29.85 | 35.49 | 32.68 |
| Image 8 | 26.2041 | 33.45 | 29.3 | 30.29 | 31.51 | 31.38 | 27.03 | 31.05 | 28.45 | 27.23 | 32.49 | 30.06 |
Table 1: Performance evaluation of different filters in terms of PSNR (dB) value.
| Sl. no | Proposed method | AWT+JB filter | AFSWM filter | MPBLOW filter | ||||||||
|---|---|---|---|---|---|---|---|---|---|---|---|---|
| Without optimization | With PSO | With HSA | Without optimization | With PSO | With HSA | Without optimization | With PSO | With HSA | Without optimization | With PSO | With HSA | |
| Image 1 | 0.69 | 0.93 | 0.75 | 0.869 | 0.885 | 0.884 | 0.754 | 0.893 | 0.854 | 0.66 | 0.902 | 0.811 |
| Image 2 | 0.67 | 0.91 | 0.79 | 0.861 | 0.877 | 0.876 | 0.747 | 0.878 | 0.846 | 0.654 | 0.888 | 0.799 |
| Image 3 | 0.69 | 0.93 | 0.83 | 0.869 | 0.885 | 0.883 | 0.754 | 0.893 | 0.854 | 0.66 | 0.902 | 0.811 |
| Image 4 | 0.67 | 0.91 | 0.79 | 0.861 | 0.877 | 0.876 | 0.747 | 0.878 | 0.846 | 0.654 | 0.888 | 0.799 |
| Image 5 | 0.64 | 0.91 | 0.7 | 0.851 | 0.874 | 0.872 | 0.731 | 0.87 | 0.838 | 0.652 | 0.888 | 0.801 |
| Image 6 | 0.71 | 0.94 | 0.84 | 0.878 | 0.893 | 0.892 | 0.769 | 0.899 | 0.86 | 0.675 | 0.909 | 0.82 |
| Image 7 | 0.7 | 0.93 | 0.75 | 0.865 | 0.88 | 0.879 | 0.754 | 0.885 | 0.855 | 0.66 | 0.896 | 0.803 |
| Image 8 | 0.57 | 0.89 | 0.74 | 0.816 | 0.846 | 0.843 | 0.6731 | 0.842 | 0.807 | 0.58 | 0.859 | 0.752 |
Table 2: Performance evaluation of different filters in terms of SNR calculation.
| Sl. No | Proposed Method | AWT+JB Filter | AFSWM Filter | MPBLOW Filter | ||||||||
|---|---|---|---|---|---|---|---|---|---|---|---|---|
| Without Optimization | With PSO | With HSA | Without Optimization | With PSO | With HSA | Without Optimization | With PSO | With HSA | Without Optimization | With PSO | With HSA | |
| Image 1 | 0.69 | 0.93 | 0.75 | 0.869 | 0.885 | 0.884 | 0.754 | 0.893 | 0.854 | 0.66 | 0.902 | 0.811 |
| Image 2 | 0.67 | 0.91 | 0.79 | 0.861 | 0.877 | 0.876 | 0.747 | 0.878 | 0.846 | 0.654 | 0.888 | 0.799 |
| Image 3 | 0.69 | 0.93 | 0.83 | 0.869 | 0.885 | 0.883 | 0.754 | 0.893 | 0.854 | 0.66 | 0.902 | 0.811 |
| Image 4 | 0.67 | 0.91 | 0.79 | 0.861 | 0.877 | 0.876 | 0.747 | 0.878 | 0.846 | 0.654 | 0.888 | 0.799 |
| Image 5 | 0.64 | 0.91 | 0.7 | 0.851 | 0.874 | 0.872 | 0.731 | 0.87 | 0.838 | 0.652 | 0.888 | 0.801 |
| Image 6 | 0.71 | 0.94 | 0.84 | 0.878 | 0.893 | 0.892 | 0.769 | 0.899 | 0.86 | 0.675 | 0.909 | 0.82 |
| Image 7 | 0.7 | 0.93 | 0.75 | 0.865 | 0.88 | 0.879 | 0.754 | 0.885 | 0.855 | 0.66 | 0.896 | 0.803 |
| Image 8 | 0.57 | 0.89 | 0.74 | 0.816 | 0.846 | 0.843 | 0.6731 | 0.842 | 0.807 | 0.58 | 0.859 | 0.752 |
Table 3: Performance evaluation of different filters in terms of SSIM.
| Sl. no | Proposed Method | AWT+JB Filter | AFSWM Filter | MPBLOW Filter | ||||||||
|---|---|---|---|---|---|---|---|---|---|---|---|---|
| Without optimization | With PSO | With HSA | Without optimization | With PSO | With HSA | Without optimization | With PSO | With HSA | Without optimization | With PSO | With HSA | |
| Image 1 | 0.536 | 0.897 | 0.728 | 0.874 | 0.889 | 0.886 | 0.461 | 0.668 | 0.657 | 0.567 | 0.741 | 0.613 |
| Image 2 | 0.453 | 0.884 | 0.516 | 0.834 | 0.871 | 0.868 | 0.414 | 0.625 | 0.636 | 0.511 | 0.683 | 0.576 |
| Image 3 | 0.536 | 0.897 | 0.609 | 0.874 | 0.889 | 0.885 | 0.462 | 0.668 | 0.657 | 0.567 | 0.741 | 0.613 |
| Image 4 | 0.453 | 0.884 | 0.624 | 0.834 | 0.871 | 0.868 | 0.414 | 0.625 | 0.636 | 0.511 | 0.683 | 0.576 |
| Image 5 | 0.512 | 0.893 | 0.695 | 0.886 | 0.897 | 0.894 | 0.422 | 0.653 | 0.639 | 0.63 | 0.738 | 0.627 |
| Image 6 | 0.553 | 0.889 | 0.718 | 0.856 | 0.878 | 0.876 | 0.456 | 0.652 | 0.658 | 0.594 | 0.73 | 0.61 |
| Image 7 | 0.513 | 0.893 | 0.714 | 0.857 | 0.887 | 0.885 | 0.427 | 0.646 | 0.646 | 0.524 | 0.724 | 0.579 |
| Image 8 | 0.464 | 0.913 | 0.538 | 0.899 | 0.924 | 0.923 | 0.437 | 0.674 | 0.641 | 0.589 | 0.724 | 0.618 |
Table 4: Performance evaluation of different filters in terms of EPI.
The quality of the image improves with increase in PSNR value and from Table 1, it is observed that better PSNR values is achieved by using PSO compared to HSA and without PSO (Figure 14).

Figure 14: Graphical representation of PSNR values for all output images.
From Table 2, it is observed that various image filters with PSO provides larger SNR value, which corresponds to good quality image (Figure 15).

Figure 15: Graphical representation of SNR values for all output images.
From Table 3, it is observed that various image filters with PSO provides values closer to 1, which predicts that good similarity is observed amongst images using PSO compared to other techniques (Figure 16).

Figure 16: Graphical representation of SSIM values for all output images.
From Table 4 it is observed that larger values are obtained by using PSO compared to other techniques which predicts that PSO has more ability to preserve edges compared to other techniques, (Figure 17). The performance analysis of various denoising filtering techniques is estimated using combined approach of anisotropic diffusion and Butterworth band pass filter along with PSO algorithm for optimization. The results obtained is tabulated and compared with the values obtained from HSA and it shows that proposed algorithm along with PSO provides better performance in denoising and avoid over filtering in ultra sound images.

Figure 17: Graphical representation of EPI values for all output images.
Conclusion
This paper proposed a new hybrid filtering technique by combining Anisotropic Diffusion along with Butterworth band pass filter to reduce the over filtering of the image. Besides, particle swarm optimization algorithm is used to optimize the design parameters of the proposed hybrid filtering for improving the denoising performance. The results show that the proposed hybrid filtering technique obtains a better denoising performance than other filtering techniques as AWT +JB Filter, AFSWM Filter, MPBLOW Filter in terms of evaluation parameters PSNR, SNR, SSIM, and EPI. Also, filtering performance of above stated filters have shown in graphical representation form for better qualitative observation. Furthermore, the results prove that the proposed filtering technique using PSO achieves effective performance than using HSA and other filtering techniques.
References
- Ramos-Llorden G, Vegas-Sanchez-Ferrero G, Martin-Fernandez M, Alberola-Lopez C, Aja-Fernandez S. Anisotropic diffusion filter with memory based on speckle statistics for ultrasound images. IEEE Trans Image Proc 2015; 24: 345-358.
- Sivakumar R, Gayathri MK, Nedumaran D. Speckle filtering of ultrasound B-scan images-a comparative study between spatial and diffusion filters. International conference on Open Systems (ICOS), IEEE Conference 2010; 80-85.
- Ramos-Llorden G, Vegas-Sanchez-Ferrero G, Martin-Fernandez M, Alberola-Lopez C, Aja-Fernandez S. Fast anisotropic speckle filter for ultrasound medical images. Mediterranean 13th Conference on Medical and Biological Engineering and Computing Springer Cham 2013; 253-256.
- Bhateja V, Singh G, Srivastava A. A novel weighted diffusion filtering approach for speckle suppression in ultrasound images. Proceedings of the International Conference on Frontiers of Intelligent Computing: Theory and Applications (FICTA) Springer Cham 2013; 459-466.
- Gupta D, Anand RS, Tyagi B. Speckle filtering of ultrasound images using a modified non-linear diffusion model in non-subsampled shearlet domain. IET Image Proc 2014; 9: 107-117.
- Coupe P, Hellier P, Kervrann C, Barillot C. Nonlocal means-based speckle filtering for ultrasound images. IEEE Trans Image Proc 2009; 18: 2221-2229.
- Yang J, Fan J, Ai D, Wang X, Zheng Y, Tang S, Wang Y. Local statistics and non-local mean filter for speckle noise reduction in medical ultrasound image. Neurocomputing 2016; 195: 88-95.
- Ambrosanio M, Baselice F, Ferraioli G, Pascazio V. Ultrasound despeckling based on non-local means. EMBEC NBC Springer Singapore 2017; 109-112.
- Zhang X, Cheng S, Ding H, Wu H, Gong N, Cheng R. Ultrasound medical image denoising based on multi-direction median filter. Info Technol Med Educ (ITME) IEEE 8th International Conference 2016; 835-839.
- Kazubek M. Wavelet domain image denoising by thresholding and Wiener filtering, IEEE Sig Proc Lett 2003; 10: 324-326.
- Farzana E, Tanzid M, Mohsin KM, Bhuiyan MIH, Hossain S. Adaptive bilateral filtering for despeckling of medical ultrasound images. IEEE Conference TENCON 2010; 2010: 1728-1733.
- Esakkirajan S, Vimalraj CT, Muhammed R, Subramanian G. Adaptive wavelet packet-based de-speckling of ultrasound images with bilateral filter. Ultrasound Med Biol 2013; 39: 2463-2476.
- Vanithamani R, Umamaheswari G. Wavelet based despeckling of medical ultrasound images with bilateral filter. IEEE international Conference TENCON 2011; 389-393.
- Kishore PVV, Sastry ASCS, Kartheek A, Mahatha SH. Block based thresholding in wavelet domain for denoising ultrasound medical images. International Conference on Signal Processing and Communication Engineering Systems (SPACES) 2015; 265-269.
- Yu Y, Acton ST. Speckle reducing anisotropic diffusion. IEEE Trans Image Proc 2002; 11: 1260-1270.
- Yu Y, Molloy JA, Acton ST. Three-dimensional speckle reducing anisotropic diffusion. Signals, Systems and Computers Conference Record of the Thirty-Seventh Asilomar Conference 2003; 2: 1987-1991.
- Krissian K, Westin CF, Kikinis R, Vosburgh KG. Oriented speckle reducing anisotropic diffusion. IEEE Trans Image Proc 2007; 16: 1412-1424.
- Bini AA, Bhat MS. Despeckling low SNR, low contrast ultrasound images via anisotropic level set diffusion. Multidimens Sys Sig Proc 2014; 25: 41-65.
- Guleryuz OG. A nonlinear loop filter for quantization noise removal in hybrid video compression. IEEE International Conference on ICIP 2015.
- Gupta D, Anand RS, Tyagi B. Speckle filtering of ultrasound images using a modified non-linear diffusion model in non-subsampled shearlet domain. IET Image Process 2014; 9: 107-117.
- Kang J, Lee JY, Yoo Y. A new feature-enhanced speckle reduction method based on multiscale analysis for ultrasound b-mode imaging. IEEE Trans Biomed Eng 2016; 63; 1178-1191.
- Chithra MS. Bayesian denoising of ultrasound images using heavy-tailed levy distribution. IET Image Proc 2014; 9: 338-345.
- Babu JJJ, Sudha GF. Non-subsampled contourlet transform based image denoising in ultrasound thyroid images using adaptive binary morphological operations. IET Comp Vis 2014; 8: 718-728.
- Gai S, Zhang B, Yang C, Yu L. Speckle noise reduction in medical ultrasound image using monogenic wavelet and Laplace mixture distribution. Elsevier Digit Sig Proc 2018; 72: 192-207.
- Baselice F, Ferraioli G, Pascazio V, Schirinzi G. Enhanced wiener filter for ultrasound image denoising. EMBEC NBC 2017; 65-68.
- Tay PC, Garson CD, Acton ST, Hossack J. Ultrasound despeckling for contrast enhancement. IEEE Trans Image Proc 2010; 19: 1847-1860.
- Fu X, Wang Y, Chen L, Dai Y. Quantum-inspired hybrid medical ultrasound images despeckling method. Electron Lett 2015; 51: 321-323.
- Perona P, Malik J. Scale-space and edge detection using anisotropic diffusion. IEEE Trans Patt Anal Mac Intel 1990; 12: 629-639.
- Iheme LO. Frequency domain band pass filtering for image processing. Electrical and Electron Eng Depart Digit Imag Proc Eastern Medit Univ 2011.
- Kennedy J, Eberhart R. Particle swarm optimization. Proc IEEE Int Conf Neur Netw 1995.
- Poli R, Kennedy J, Blackwell T. Particle swarm optimization. Swarm Intel 2007; 1: 33-57.
- Pal S, Singh B, Deep K. Use of particle swarm optimization algorithm for solving integer and mixed integer optimization problems. Int J Comp Sci Commun Technol 2011; 4: 663-667.
- Yang XS. Harmony search as a Metaheuristic algorithm, music-inspired harmony search algorithm: theory and applications. Studies Comp Intell Springer Berlin 2009; 191: 1-14.
- Wang Y, Wang J, Song X, Han L. An efficient adaptive fuzzy switching weighted mean filter for salt-and-pepper noise removal. IEEE Sig Proc Lett 2016; 23: 1582-1586.
- Cao M, Li S, Wang R, Li N. Interferometric phase denoising by median patch-based locally optimal wiener filter. IEEE Geosci Remot Sens Lett 2015; 12: 1730-1734.
- Bibina VC, Viswasom S. Adaptive wavelet thresholding and joint bilateral filtering for image denoising. IEEE International Conference INDICON 2012; 1100-1104.
- A Gallery of High-Resolution, Ultrasound, Color Doppler and 3D Images-Liver available online at http: //www.ultrasound-images.com/liver/