Research Article - Biomedical Research (2018) Medical Diagnosis and Study of Biomedical Imaging Systems and Applications
A new approach for the image compression to the medical images using PCA-SPIHT
Rajasekhar Reddy M1*, Ravichandran KS1, Venkatraman B2 and Suganya SD1
1School of Computing, SASTRA University, Thanjavur - 613401, Tamil Nadu, India
2Radiological Safety and Environmental Group, IGCAR, Kalpakkam, India
Accepted date: July 20, 2017
DOI: 10.4066/biomedicalresearch.29-17-1192
Visit for more related articles at Biomedical ResearchAbstract
In this paper, Principal Component Analysis (PCA) with Set Partitioning in Hierarchical Trees (SPIHT) propounds to accomplish an image compression. A lossy technique is introduced through the PCA which is followed by SPIHT to enhance the compression performance. The Peak Signal to Noise Ratio (PSNR) value of the reconstructed image acquired from the PCA methods is not found to be sufficient which can be further improved by another method called SPIHT. In this paper, a hybrid compression model is constructed to accomplish the benefits of both PCA and SPIHT. In the bio-medical research, compression becomes necessary due to transfer of patients images from one group of experts to other experts group. So that, the proposed image compression technique is useful for conserving the storage space needed for healthcare systems. Finally, it is concluded that the proposed PCA-SPIHT performs better than other recent state-of-the-art techniques with acceptable loss of image quality.
Keywords
Compression, PCA, SPIHT, Medical images, PSNR
Introduction
Image compression plays a decisive role in many fields like medical, astronomy, communication, satellite and so on [1,2]. In the bio-medical research, compression becomes necessary due to transfer of patients images from one group of experts to other experts group with or without encryption. The image compression technique is useful to reduce the storage space needed for healthcare systems. Medical image contains large data and therefore it is essential to store images in more spaces as well as takes a slow transmission rate. Due to this reason, compression algorithms are required. A compression [3,4] scheme minimizes the amount of bits needed to designate an image. As a result, compressed image requires lesser storage space and makes a faster transmission from one point to another point. The smaller amount of bits needed to exemplify an image by eliminating the redundant bits from an image with acceptable image quality are the salient features of an image compression. In bio- medical field, X-Ray, MRI scan, CT scan images can be very useful for identifying the conditions of kidney, fractured leg, brain, neck region and so on. Compression in bio medical field is mandatory due to limitations of storage capacity for maintaining the patient’s records and by doing compression on images, image quality needs to be preserved. The patients information such as x-ray images, scan results, and so on are transferred from one group of persons to others in order to discuss patients health condition with some experts in medical field. This process of exchanging patient’s information is called telemedicine health care system. Telemedicine health care system can able to help the patients through bio medical images. In the field of biomedical engineering, compression becomes necessary to reduce space for storing an image. The proposed image compression techniques useful for conserving the storage space needed for healthcare systems. Image compression techniques [4,5] can be typically classified into loss and lossless technique. Lossless compression is preferred for medical images but in some cases, lossy compression with adequate quality will be utilized. Natural images are suitable for lossy compression techniques.
Lossy techniques cannot be able to recover the original image from the reconstructed image because some redundant information will be removed during compression. Lossless technique can get back the original image exactly from the reconstructed image [6]. Compression can be performed through the variety of techniques such as transform based coding like DCT [7], DWT [8], SVD [9], PCA [5] and wavelet based compression techniques like EZW [10], SPIHT [11], WDR [12], JPEG2000 [13] and so on. Gaidhane et al. [14] implemented a compression using PCA and also with neural network algorithms on satellite image In PCA method, it is extremely hard to find covariance matrix, eigen value and eigen vectors of an input image. Images are compressed using PCA in which compressed result is not found to be sufficient. The result can be improved by ANN algorithm which gives better results. The image compression for color image using PCA has been developed by Mohammad Mofarreh-Bonab et al. [15]. A single color image which includes RB components are compressed by utilizing PCA method.
The image compression performed through wavelet transform provides best result as compared to DCT for ultrasound and angio images are analysed by Puniene et al. [16]. DCT method suffered from blocking artifacts. DCT and SPIHT based compression techniques are implemented on medical images was done by Angadi et al. [17]. Medical image is decomposed using DCT, and then its coefficients are compressed using SPIHT. A lossy image compression by combining singular value decomposition (SVD) and wavelet difference reduction techniques (WDR) are proposed by Rufai et al. [9]. SVD compression provides good quality of image but at low compression ratio. So, the output of the SVD was again compressed through WDR. WDR achieves very good image quality at high compression ratio. As result shows that SVD followed by WDR gives better image quality than WDR and JPEG 2000 Techniques. An ECG signal compression is performed by Ranjeetkumar et al. [18] through combination of SVD and Embedded Zero Tree wavelet method. SVD followed by EZW method has been experimentally analysed and verified, which achieves better quality of reconstructed signal. The combination of SVD and EZW based compression methods conserves a lot of storage space required for health data centers and transmission rate in telemedicine system. Said [11] introduced an efficient image compression technique based on SPIHT. SPIHT gives a better performance when compared to EZW. SPIHT can achieve higher PSNR value than EZW.
Sheltami et al. [19] performed an image compression using DCT and DWT techniques in wireless sensor networks. Discrete wavelet transform provides better PSNR value as well as faster compression method when compared to discrete cosine transform. In wireless sensor networks, each node has very limited resources such as memory, energy and processing capabilities. In order to overcome those limitations, DCT and DWT based image compression techniques are utilized to reduce the memory space and storage consumption. They have assessed both DCT and DWT techniques by using variety of performance measures and thus the experimental results exhibited that discrete wavelet transform performs better than the discrete cosine transform with respect to PSNR value. Even though, discrete cosine transform yields better compression ratio than discrete wavelet transform. Raja et al. [20] implemented an image compression on gray scale images with SPIHT, EZW and SOFM techniques. Their performances are measured via PSNR and MSE values. The image compressed using SPIHT yields better quality as compared to EZW and SOFM. From the result analysis, SPIHT gives higher PSNR and less MSE value when compared with EZW and SOFM methods.
Methods and Materials
PCA
PCA [4,21] technique is also called as KL Transform (Karhunen-Loeve). Karhunen and Loeve introduced this technique for continuous random process. The discrete formulation of the KL transform has been studied by the Harold Hotelling, so that the KL transform is also known as the Hotelling transform [15,22]. The KL transform is based on the orthogonal eigen vectors of the covariance matrix of a dataset. It de-correlates the pixels of an input image. After performing the transformation, maximum energy of the transformed coefficients is concentrated within the first few components which resembles an energy compaction property of KL transform. The KL transform is widely used in image compression [23] and clustering analysis because it minimizes the dimensions of an image or a dataset. PCA [24,25] is a dimensionality reduction technique which minimizes the large amount of interrelated variables.
The step by step procedure for an image compression using PCA is summarized as follows:
1. Find the vector from the given image matrix (X).
2. Obtain the Covariance matrix CV(X).
3. Eigen values are determined by solving the characteristics equation. Similarly, Eigen vectors are calculated through the characteristic equation for each Eigen values.
4. Each Eigen vector should be normalized.
5. Form the KL Transformation matrix M from the normalized eigen vectors as their columns
6. Finally, derived the KL transform of the input image through the formula Z=XMT
7. From the transformed coefficients, input values are reconstructed. Compression is achieved by minimizing the dimensionality of the input image matrix.
SPIHT
In SPIHT [11], first input image is decomposed through the discrete wavelet transform (DWT). DWT [10,26] breaks the image in to low (LL) and high frequency components (LH, HL, HH) at different levels of resolution. The maximum energy of an image is concentrated LL sub component. An LL, LH, HL and HH denote approximation component, vertical, horizontal, and diagonal components respectively [8,27]. LL sub component is again decomposed into low and high frequency components at second level which is shown in Figure 1.

Figure 1: DWT 2 level of decomposition.
After performing DWT, transformed pixel values are stored in each level of component. The SPIHT employs a hierarchical quad tree data structure for the transformed pixel values. The set of root node and its subsequent descendants are called as spatial orientation trees (SOT). The quad tree implies that each node should have either no leaves or four child nodes. The pixels on the top left LL sub components in maximum decomposition level of an image are the root node which does not have any descendant. The pixels on other each sub components such as LH, HL, HH has four child nodes. The set of co-ordinates are defined to represent the tree structure.
1. O(x, y) holds the entire children of node (x, y)
2. D(x, y) keeps the entire descendants including children of the node ( x, y)
3. H(x, y) holds the entire SOT nodes
4. L(x, y)=D(x, y)-O(x, y) children nodes subtracted from the descendants node.
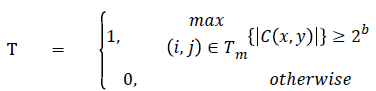
To perform significance test, function can be mathematically expressed by
In SPIHT [28] sorting stage, significance test is executed as well as their position and its sign bits are encoded. It utilizes three types of lists [29] which includes significant pixel (SP) list, insignificant pixel (IP) list and Insignificant Set (IS) list [30]. Whereas, in IS list, each node belongs to either D(x, y) or L(x, y). IP contains nodes that need to be analysed. SP list holds assessed significant pixels.
The Pseudo code to perform SPIHT coding is given below:
1. Initialization:
Output b=|log2(max{|C(x,y)|})|
Assign the SP list=Ø, (x,y) ϵ H
Append the pixels (x,y) ϵ H to the IP
Append the pixels (x,y) ϵ H node with descendants to IS
2. Sorting stage
For each node (x,y) in the IP list perform the following:
Output T(x,y),
If T(x,y)=1, then shift (x,y) pixel coordinates to the SP list Return the sign of C(x,y)
For each node (x,y) in IS list perform the following:
If the node (x,y) of type D(x,y) then
Output T(D(x,y)),
If T(D(x,y))=1, then
For each (x,y) ϵ O(x,y) i.e. four children belongs to D(x,y) perform the following:
Output T(k,x),
If T(k,x)=1 is true
Shift (k,x) to the SP list
Return the sign of C(k,1)
Else If T(k,1)=0 is true
Shift (k,1) to the end of the IP list
End If
If L(x,y) ≠ 0 then
Shift that (x,y) pixel to the end of IS list which is of type under L(x,y) and go to step 2.2.2.
Else eliminate entry (x,y) from the IS list,
End If
If the node (x,y) of type L(x,y) then, Output T(L(x,y)),
If T(D(x,y))=1 then, shift each (k,1) ϵ O(x,y) to the end of the IS list as of type D(x,y)
Eliminate (x,y) from the IS list
End If
3. Refinement stage
In SP list, each and every entry, excluding those added in last sorting pass, return the bth MSB of the |Cx,y|
4. Quantization
At each pass, b will be decremented by 1 and repeat step 2.2.
Discrete cosine transform (DCT)
The compression is the important applications of DCT. The basic idea of DCT is to convert a signal/image into basic frequency components. The primary function of DCT based on cosine functions. In order to achieve a compression, an image is separated into a several amount of blocks. Each block of an image can be expressed as a sum of cosine functions on different frequencies. DCT [4] converts a spatial representation of data into a frequency representation. The procedure to perform [31] an image compression using discrete cosine transform is as follows:
• The input image is divided into 8X8 blocks of pixels
• DCT is applied to each block
• Each block is compressed through a process called quantization which eliminates redundant information pixels of an image.
• After the quantization step, resulting blocks comprises that the image is highly compressed and occupy less space
• Image can be reconstructed using Inverse Discrete Cosine Transform
Proposed Technique
In the proposed methodology, lossy compression methods are introduced which includes the PCA and SPIHT algorithms to medical images. A proposed method works by two steps as follows.
Input: Medical image of size 512 × 512
Output: Reconstructed image through the proposed technique (PCA followed by SPIHT)
1. In first step, image is compressed using PCA. It packs most of the image information in the first few components itself. Compression is done by fetching first few principal components of an image.
2. Then the image can be reconstructed by using first few transformed coefficients. It is considered as an optimal transform method with respect to its energy compaction property.
3. Hence, it is a lossy technique which gives good PSNR value, but at low compression ratio.
4. Even though, it has more energy compaction property, PCA is an image dependent whose basis function is not fixed. As, PSNR value indicates the quality of an image. So, PSNR value of the PCA can be improved by wavelet based compression algorithm.
5. During the second step, SPIHT is a wavelet based compression technique which offers very good PSNR value as compared to PCA. So, the quality of the reconstructed image obtained from the PCA method can be further improved through the SPIHT algorithm.
6. In SPIHT, initially DWT is applied to the image reconstructed by PCA in order to acquire the transformed coefficients.
7. Then the SPIHT coding can be carried out through the transformed coefficient values. The performances of the compression is obtained from the PCA methods is not found to be satisfactory.
8. In order to improve the performance, SPIHT is utilized. While SPIHT uses DWT, which gives higher PSNR value as well as better quality than PCA. So, that PCA followed by SPIHT method is proposed. The overview of the proposed technique is shown in Figure 2.

Figure 2: Overview of the proposed technique.
Parameter Evaluation
The image quality can be sustained through the various quality parameters like PSNR, Structural Content (SC) and SNR values which are mathematically shown in equation. PSNR in equation (1) is one of the eminent parameter to measure the quality of the reconstructed image. PSNR is defined as the ratio between the maximum power of an image and the power of the corrupted noise in the reconstructed image.
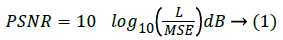
Here, L represents the maximum pixel values in an image.
The MSE (Mean Square error) is calculated among the original and reconstructed image which is shown as below:
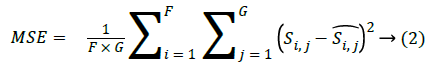
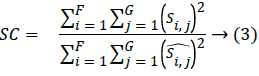
Where, F × G indicates the dimension of the image,  and Si,j represents the reconstructed image and original image of size F × G respectively. One more parameter is used to measure the quality of the image is through the SC which provides lower quality of the image, when the SC value is larger.
Experimental Analysis
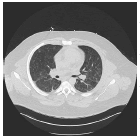
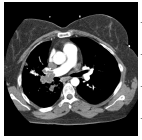
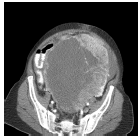
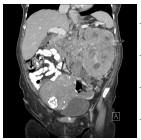
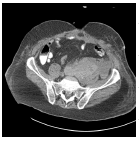
The input images [32,33] of size 512 × 512 which is shown in first column of the Table 1 are experimented with individual DCT, SPIHT, PCA, PCA followed by DCT and the proposed technique (PCA followed by SPIHT). From the experimental results, PSNR value of the reconstructed image in Table 1 shows that the Proposed PCA followed by SPIHT method is found to be better in terms of PSNR value when compared to other methods. If the PSNR value for the particular medical image is high, then the quality of the reconstructed image will be high. The sample original image in Figure 3a and decompressed image using variety of technique with PSNR value is illustrated in Figure 3.

Figure 3: A) Original image; B) PSNR value is 29.89 dB between original and DCT reconstructed image; C) PSNR value is 30.66 dB between original and PCA reconstructed image; D) PSNR value is 41.23 dB between original and SPIHT reconstructed image; E) PSNR value is 33.76 dB between PCA-DCT method; F) PSNR value is 42.91 dB for the proposed technique.
| Image | Methods | PSNR | SC | SNR |
|---|---|---|---|---|
 |
DCT | 24.46 | 1.0 | 19.3 |
| PCA | 24.51 | 1.0 | 19.4 | |
| SPIHT | 29.56 | 0.01 | 24.4 | |
| PCA-DCT | 30.97 | 1.0 | 25.7 | |
| PCA-SPIHT | 40.69 | 0.01 | 35.4 | |
 |
DCT | 29.89 | 1.0 | 21.8 |
| PCA | 30.66 | 0.9 | 21.1 | |
| SPIHT | 41.23 | 0.01 | 32.4 | |
| PCA-DCT | 33.76 | 1.0 | 24.8 | |
| PCA-SPIHT | 42.91 | 0.01 | 34.0 | |
 |
DCT | 29.99 | 1.0 | 22.8 |
| PCA | 29.26 | 0.9 | 22.1 | |
| SPIHT | 37.25 | 0.01 | 30.1 | |
| PCA-DCT | 34.24 | 1.0 | 27.0 | |
| PCA-SPIHT | 41.65 | 0.01 | 34.4 | |
 |
DCT | 28.73 | 1.0 | 21.7 |
| PCA | 29.31 | 0.9 | 22.2 | |
| SPIHT | 38.73 | 0.0 | 31.6 | |
| PCA-DCT | 31.51 | 1.0 | 24.4 | |
| PCA-SPIHT | 41.69 | 0.01 | 34.6 | |
 |
DCT | 27.68 | 1.0 | 19.3 |
| PCA | 28.01 | 0.9 | 19.6 | |
| SPIHT | 35.50 | 0.01 | 27.1 | |
| PCA-DCT | 31.62 | 1.0 | 23.1 | |
| PCA-SPIHT | 41.36 | 0.01 | 32.9 |
Table 1. Quality measures of the different techniques.
Figure 4 shows that the Bar plot for PSNR value to five various medical images with different existing techniques. PSNR value of the second image in Table 1 is 42.91 dB for the proposed technique which is 12.24 dB, 13.02 dB, 1.68 dB and 9.15 dB more than the individual DCT, PCA, SPIHT and PCA-DCT methods respectively. Higher PSNR value indicates that the reconstructed image at better quality. In order to ensure the standardization, the proposed method PSNR values achieve better quality than similar studies [34] such as JPEG, JPEG2000 and SPIHT. From the analysis, it has been proved that the proposed PCA followed by SPIHT technique gives accuracy of 29% in terms of PSNR value, which is found to be better when compared with accuracy of 16.5%, 19%, 23% and 17% for individual DCT, PCA, SPIHT and PCA followed by DCT methods respectively.

Figure 4: Bar chart for the proposed technique PSNR value and other existing techniques PSNR values.
Conclusion
In this paper, image compression using PCA followed by SPIHT is implemented. The proposed technique is compared with the individual DCT, PCA, SPIHT and PCA followed by DCT. It has experimentally analysed and proved that the proposed technique provides better PSNR value which resembles that the reconstructed image obtained from the proposed technique gives high quality image than the other existing techniques.
References
- Garcia-Vilchez F, Munoz-Mari J, Zortea M, Blanes I, Gonzalez-Ruiz V, Camps-valls G, Plaza A, Serra-Sagrista J. On the impact of lossy compression on hyperspectral image classification and unmixing. IEEE Geosci Remote Sens Lettr 2011; 8: 253-257.
- Glatard T, Lartizien C, Gibaud B, da silva R.F, Forestier G, Cervenansky F, Alessandrini M, Benoit-Cattin H, Bernard O, Camarasu-Pop S, Cerezo N, Clarysse P, Gaignard A, Hugonnard P, Liebgott H, Marache S, Marion A, Montagnat J, Tabary J, Friboulet D. A virtual imaging platform for multi-modality medical image simulation. IEEE Transact Med Imag 2013; 32: 110-118.
- Gonzalez RC, Woods RE. Digital image processing (3rd Ed) Prentice-Hall, USA 2008.
- Jayaraman S, Esakirajan S, Veerakumar T. Digital Image Processing. Tata McGraw Hill Education, USA 2012.
- Taur JS, Tao CW. Medical image compression using principal component analysis. Proceedings of 3rd IEEE International Conference on Image Processing, Lausanne 1996.
- Rufai AM, Anbarjafari G, Demirel H. Lossy medical image compression using Huffman coding and singular value decomposition. IEEE Signal Processing and Communications Applications Conference 2013.
- Telagarapu P, Jagan V, Lakshmi A, VijayaSanthi G. Image Compression using DCT and wavelet transformation. Int J Signal Process, Image Process Pattern Recognit 2011; 4: 61-74.
- Antonini M, Barlaud M, Mathieu P, Daubechies I. Image coding using wavelet transform. IEEE Transact Image Process 1992; 1: 205-220.
- Rufai AM, Anbarjafari G, Demirel H. Lossy image compression using singular value decomposition and wavelet difference reduction. Digital Signal Process 2014; 24: 117-123.
- Shapiro JM. Embedded image coding using zero trees of wavelet coefficients. IEEE Transact Signal Process 1993; 41: 3445-3462.
- Said A, Pearlman WA. A new, fast and efficient image codec based on set partitioning in hierarchical trees. IEEE Transact Circuit Syst Video Technol 1996; 6: 243-250.
- Raja SP, Suruliandi A. Image compression using WDR and ASWDR Techniques with different wavelet codecs. ACCEEE Int J Informat Technol 2011.
- Walker JS, Chen Y, Elgindi TM. Comparison of the JPEG2000 lossy image compression algorithm with WDR-based algorithms. International Conference on Image Processing 2006.
- Gaidhane V, Singh V, Kumar M. Image compression using PCA and improved technique with MLP neural network. International Conference on Advances in Recent Technologies in Communication and Computing 2010.
- Mofarreh-Bonab M, Mofarreh- Bonab M. Color image compression using PCA. Int J Comput Appl 2015.
- Puniene J, Punys V, Punys J. Ultrasound and angio image compression by cosine and wavelet transforms. Int J Med Informat 2001; 64: 473-481.
- Angadi S, Somkuwar A. Medical image compression using DCT and SPIHT algorithm. Int J Electron, Commun Soft Comput Sci Eng 2014; 2: 10-13.
- Kumar R, Kumar A, Singh GK. Hybrid method based on singular value decomposition and embedded zero tree wavelet technique for ECG signal compression. Comput Methods Programs Biomed 2016; 29: 135-148.
- Sheltami T, Musaddiq M, Shaksuki E. Data compression techniques in wireless sensor networks. Future Gen Comput Syst 2016; 64:151-162.
- Raja SP, Suruliandi A. Analysis of efficient wavelet based image compression techniques. Second International Conference on Computing, Communication and Networking Technologies 2010.
- doEsprito Santo R. Principal component analysis applied to digital image compression. Hospital Israelita Albert Einstein HIAE, Sao Paulo (SP), Brazil 2012.
- Mofarreh-Bonab M, Mofarreh-Bonab M. A new technique for image compression using PCA. Int J Comput Sci Commun Networks 2012; 2: 111-116.
- Charles ZL, Kavakli M. Extensions of principle component analysis with applications on vision based computing. Multimedia Tools Appl 2016; 75: 10113-10151.
- Chen Y, Huang Z, Sun H, Chen M, Tan H. Lossy image compression using PCA and contourlet transform. MATEC Web of Conferences 2016.
- Jolliffe IT. Principal component analysis. Springer-verlag, New York, USA 1986.
- SmithaJoce P, Jayanand PG. Performance analysis of medical image compression techniques. IEEE 2012.
- Hagag A, Hassan ES, Amin M, Abd EL-Samie FE, Fan X. Satellite multispectral image compression based on reoving sub-bands. Optik 2017; 131: 1023-1035.
- Nayebi S, Miranbeigi MH, Nasrabadi AM. An improved method for 2-D ECG compression based on SPIHT algorithm. 30th Annual International IEEE EMBS Conference 2008.
- Lu Z, Kim DY, Pearlman WA. Wavelet compression of ECG signals by the set partitioning in hierarchical trees (SPIHT) algorithm. IEEE Transact Biomed Eng 2000; 47: 849-856.
- Lin L, Meng Y, Chen JP, Li ZB. Multichannel EEG compression based on ICA and SPIHT. Biomed Signal Process Control 2015; 20: 45-51.
- Ahmed N, Natrajan T, Rao K.R. Discrete Cosine Transform. IEEE Transact Comput 1974; 23: 90-93.
- https://idash-data.ucsd.edu/ community /42
- https://imagej.nih.gov/ij/images/
- Elhannachi SA, Benamrane N, Abdelmalik TA. Adaptive medical image compression based on lossy and lossless embedded zerotree methods. J Informat Process Syst 2017; 13: 40-56.