Research Article - Asian Journal of Biomedical and Pharmaceutical Sciences (2016) Volume 6, Issue 59
Optimization of Ibuprofen Carrying Poly-(3-Hydroxybutyrate) Extended Release Tablet by Central Composite Design
Akshay Jirage1, Khyyam Shaikh1, Kate Vaishali1 and Payghan Santosh1,2*
1Department of Pharmaceutics, Tatyasaheb Kore College of Pharmacy, Warananagar, Tal. Panhala, Dist. Kolhapur-416113, India
2Shivaji University, Kolhapur, India
- *Corresponding Author:
- Santosh Ambadas Payghan
Department of Pharmaceutics Tatyasaheb Kore college of Pharmacy Warananagar, Panhala, Kolhapur-416113, India.
Tel: +919096202858
E-mail: sapayghan.tkcp@gmail.com
Accepted October 24, 2016
Abstract
Context: Novel poly-(3-hydroxybutyrate)-based systems for controlled release of anti-inflammatory drug has been studied.
Methods: Ibuprofen diffusion processes determine the rate of the release at the early stages of the contact of the system with the environment (the first 6-8 h). The coefficient of the release diffusion of a drug depends on its nature, the thickness of the poly-(3-hydroxybutyrate) films containing the drug, the concentrations of Ibuprofen, and the molecular weight of the poly-(3-hydroxybutyrate). The use of central composite design (CCD) is used to map the optimal composition range for process parameters; this technique is mainly used to map the optimum ER Tablets. PHB base ER tablet of ibuprofen was prepared by direct compression technique and characterized by physicochemical parameters. The prepared tablets were evaluated physical properties hardness, friability, disintegration time and in vitro drug release.
Results and discussion: The drug release pattern, kinetic profiles as well as the low rate of IF release from the tablet is in satisfactory agreement with kinetics of weight loss measured in vitro for the PHB Tablet.
Conclusion: The results obtained are critical for developing systems of release of diverse drug, thus, enabling the attainment of the requisite physiological effects on tissues and organs of humans.
Keywords
Poly-β-hydroxybutyrate (PHB) biodegradable polymers, Extended Drug Release, Central composite design.
Introduction
Bio-based polymers are materials which are produced from renewable resources [1]. The terms bio-based polymers and biodegradable polymers are used comprehensively in the literature, but there is a key difference between the two types of polymers [2]. Biodegradable polymers are defined as materials whose physical and chemical properties undergo decline and completely mortify when exposed to microbes, carbon dioxide (aerobic) processes, methane (anaerobic processes), and water (aerobic and anaerobic processes) [3-4]. Bio-based polymers can be biodegradable or non-degradable. Similarly, while many bio-based polymers are biodegradable, not all biodegradable polymers are bio-based [5]. Biodegradable polymers are seen as the budding solution to manage problems concerning worldwide environmental and solid waste management. These biodegradable plastic materials can retain the desired material properties of conformist synthetic plastics, and can be completely degraded without parting any undesirable rest [6]. With the aim of substituting the functionality of plastics of petrochemical source, as well as mounting the range of application of bioplastics to an extensive range, polyhydroxyalkanoates (PHAs) are supposed as the most suitable materials because of their adaptability in terms of physical properties and chemical characteristics [7].
Accumulation of polyhydroxyalkanoates (PHAs) in bacteria, a natural biodegradable and biocompatible thermoplastic polymer, has been well documented throughout the years since its discovery in 1925 by Lemoigne [8]. The polymer composition largely depends on the type of bacteria as well as the carbon sources used in the fermentation process. Thus, the PHA family represents an interesting group of biodegradable polymers that can be produced from renewable resources and have various applications, e.g., in packaging, agriculture, marine, and medical fields. Among the 150 different types of PHA produced in bacteria, homopolymer P-(3HB) is the most studied PHA up to now [8].
Polyhydroxybutyrate (PHB) is the most widely studied member of the PHA family and the first one that has been produced at industrialized scale. It has been used, among other applications, to produce bottles, films, and fibers for biodegradable wrapping materials and as mulch films for agriculture [9,10]. However, applications of PHB are not restricted to these areas, and they have been extensive to osteosynthetic resources, bone plates, surgical sutures, rivets, tacks, and many other materials in medicine [9,11]. At industrial level, PHB is commonly produced from cupriavidus necator (Alcaligenes eutrophus) and Alcaligenes latus (Azohydromonas lata). These microbes can accrue PHB up to 80% of the dry cell weight [12].
There is generous interest in development of biodegradable polymer like PHB by environmentally efficient bacterial origin. This may help to solving trouble produced by synthetic or semi-synthetic polymer. Synthetic Polymer may produce hazardous problem during formulation that produce the bioaccumulation in the body [13]. This accumulated trace of polymer creates health related problems. PHB are found functionally more and can be better for use in pharmaceutical formulations. This will help to improve pharmaceutical drug delivery of different therapeutic agent [13]. This biopolymer is effective tool to control or extend the drug release rate of pharmaceutical formulation. PHB is the biopolymer include in formulation because of their thermoplasticity and biodegradability features [12]. It is considered as more environmentally friendly and sustainable method for obtaining the polymer. These improvements contribute to make medical treatment more efficient and to minimize side effects and other type inconvenience for patients [13,14].
The current study was based on screening of biopolymer which would satisfy the rising demand of sustainable economic biopolymer production from bacterial genera. Screened Poly-β-hydroxybutyrate (PHB) has found to be an optimistic role in biomedical applications and pharmaceutical drug delivery scenario. The variety of (semi) synthetic polymer available in market and these many synthetic polymers are being used now-a-days in drug delivery systems synthetic polymers have certain disadvantages such as their high production cost, nonbiodegradability, toxicity, and so it proven their impact on probability of bioaccumulation [15]. Such accumulation for long time hampers the human health. Hence these demerits avoided by application of screened biopolymer candidate PHB as drug release retardant tool [15].
The buildup of inflammatory processes may be regulated by systemic administration of anti-inflammatory preparations [14]. In certain cases, however, this approach is not efficient, because the local concentrations of the drugs within the region of the implantation are either not sufficient for attaining the pharmacological effect or lack stability, whereas any further increase in the dose administered systemically entails side effects [14]. Systems of controlled release of drugs, based on polymer materials, make it possible to regulate the processes of inflammation, thrombus formation, and development of new tissue within the immediate vicinity of implantation of medical devices. In designing such systems, it is important to make the right choice of the drug [14].
The use of Central Composite experimental design (CCD) is required to map the optimal composition range for process parameters; this technique is mainly used to map the optimum nano emulsion, Tablets, suspensions etc. [16,17]. In the present work, the preparation of Ibuprofen loaded PHB based ER Tablet is discussed and use of CCD explored to map the optimal composition range and can be used to show the influence of composition of PHB on extended release pattern ibuprofen.
Ibuprofen (IF), a nonsteroidal anti-inflammatory drug (NSAID), inhibits cyclooxygenase, thereby preventing the synthesis of prostaglandins (which are major mediators of inflammation), and cell proliferation [14]. It is noteworthy that IF, as well as PHB, are soluble in organic solvents (chloroform and methylene chloride), which simplifies the technology of creating polymer systems of controlled release [10].
The molecular weight (MW) of a polymer considerably affects the kinetics of the release of drugs introduced into its matrix [13]; for this reason, development of controlled release systems for drug that have predefined characteristics requires a technology for synthesizing polymers with a particular MW. When PHB is obtained using biotechnological methods, the conditions of culturing of the PHB producer strains may influence the molecular weight of the polymer [13]. Thus, a technology for the biosynthesis of PHB with a defined MW is prerequisite to creating controlled release systems for the requisite characteristics of the kinetics of the drug release from the polymer matrix. The use of such systems for controlled release of anti-inflammatory drugs is expected to regulate inflammatory processes and the rate of the implant biodegradation and capsulation. In this work, we sought to obtain and study PHB based films incorporating IF.
Materials and Methods
Reagents and samples
All the Analytical grade materials were used. Ibuprofen reference standard was collected from Asoj Soft Caps. Pvt. Ltd., India. Extended release tablets were formulated using mannitol, talc, Mg stearate, colloidal silicon dioxide (Aerosil) as excipients. Acetonitrile (HPLC grade), Distilled water (HPLC grade) were used as analytical grade solvent for analysis purpose [18]. All the excipients and solvents were purchased from Loba Cheme, Mumbai. The reagents 0.1 N Sodium Hydroxide, Phosphate buffer solution pH 7.2, PBS (pH 6.8) was prepared according to compendial procedure [19].
Analytical method
All the chemicals and reagents were made according to official compendial requirements. The 0.2 N sodium hydroxide (NaOH), N Hydrochloric Acid (HCL), 0.2 M Potassium chloride (KCl), 0.2 M Potassium dihydrogen phosphate (KH2PO4), Hydrochloric acid Buffer solution pH 1.2, Phosphate buffer solution pH 6.8 etc. were prepared according to compendial specifications.
Biosynthesis of PHB
The PHB strain used in this work (Bacillus megaterium ATCC 6748) was capable of synthesizing PHB in an amount of up to 80% on the dry weight basis of the cells [20-22]. A lyophilized culture was reactivated at 30°C for 24 h in a growth medium as Nutrient agar medium containing Nutrient Agar (NA) 3.5%, Peptone 2.5%, NaCl 0.5%, Yeast 0.1%, Beef extract 0.5%, Agar powder 3% and Distilled water [23]. The nutrient components as sugar, nitrogen, phosphate and trace elements were sterilized separately at 121°C for 20 min. A collection of strains of the genus Bacillus megaterium were maintained on Nutrient Agar medium [23]. To achieve cellular PHB hyper production, the culture of the Bacillus megaterium strain was grown on nutrient agar medium in excess of content of the carbon source [24]. The process of isolation and purification from the biomass of Bacillus megaterium ATCC 6748 included the following stages: dissolution of PHB in chloroform by shaking at 37°C for 12 h, separation of the PHB solution from the cell residue by filtration, isolation of the PHB by non-solvent precipitation method comprising (7:3 v/v) methanol and water, and repeated its dissolution in chloroform followed by saturated cell mass suspension precipitation and drying at 60°C PHB crystals emerge out [19-24].
Drug interactions with PHB
All Interactions between the ibuprofen and PHB base polymer were studied by spectral and thermodynamic changes for evaluation of physical and chemical integrity of prepared ER tablets.
Infra-red spectral analysis: The Possibility of drug excipient interaction was investigated by Fourier Transform Infra-red spectroscopy (Cary-60 ATR, Agilent). The FTIR spectra of ibuprofen and drug PHB mixtures were recorded. FTIR spectrometer in the range of 4000- 400 cm-1, study was carried out to detect any changes on chemical constitution of the drug after combined it with the PHB [25,26].
Differential Scanning calorimetry: Thermo grams of pure ibuprofen were taken for DSC study. An empty aluminum pan was used as a reference. DSC (METTLER TOLEDO STARe System, Germany) measurements were performed at a heating rate of 5°C/min from 50-400°C using aluminium sealed pan. The sample size was 5 mg of ibuprofen and 5 mg of physical mixture of PHB for measurements. During the measurement, the sample cell was purged with nitrogen gas at 40 ml/min [27-29].
PHB based extended release Ibuprofen tablet
Preparation of mixtures/powder blend: Coarse (lactose monohydrate) and polymer (PHB/HPMC K100 M) were covered with Ibuprofen by dry mixing. This material was mixed in a teflonized metal jar of All Purpose Mixer (Shakti corp., Mumbai) at 90 rpm for 24 hrs. Talc, Mg stearate, colloidal silicon dioxide (Aerosil) were added to the interactive mixture and mixed at 30 rpm for an additional 48 hrs. The flavor was added in interactive mixture and mixed for 1 hr at 30 rpm [30,31].
Determination of mixture homogeneity: The content of Ibuprofen was used to express the quality (i.e. heterogeneity) of the mixtures. Samples of each mixture weighing 500 mg were withdrawn with the aid of sample thieves/Spatula [32]. The amount of Ibuprofen in the samples was measured spectrophotometrically (Shimedazu corp. Japan) at a wavelength of 222 nm.
Compaction of tablets: Prior to compaction, all tablet masses were mixed with magnesium stearate in the tumbling mixer at 30 rpm for 2 min. Tablets were made in 8 station Rota press (Karnavati, Ahmadabad) using 9 mm flat edged punches; the powder was filled into the die with a feed frame. The tablets contained Ibuprofen 200 mg in bases. Each batch comprised 100 tablets. Ibuprofen extended release tablets were prepared by direct compression method [33,34]. A total number of thirteen formulations (F1 to F13) of Ibuprofen tablets were prepared.
Before tablet preparation, the mixture blend of the formulations were subjected to precompression study parameters like Angle of repose, bulk density, tapped density, compressibility index and hausner’s ratio [35,36].
Design of experiment
Optimization PHB based extended release Ibuprofen tablet: In this work, central composite design (CCD) was used simultaneously to study the effect of the two process parameters involved in the preparation of ER tablet by direct compression against two response variables. CCD is a response surface design which provides information on direct effects, pair-wise interaction effects, and curvilinear variable effects and is widely used for formulation and process optimization in the field of pharmaceutics [37].
The main object of the present study to use optimum quantity of polymer in formulation with application of variable compression force to obtain the effective ER compact with hardness that would provide mechanical strength to the formulation [38]. The obtained ER tablet withstand the drug release for prolonged period time, central composite design (CCD) was selected with 2 factor, 3 level and 13 run was selected to statistically optimize the formulation parameter and evaluate the main effects, interaction effect and quadratic effect of the formulation ingredient on the hardness, % drug release of Ibuprofen ER tablet.3- factor 2- level design was used in the study to explore quadratic response surfaces and for constructing polynomial models thus helping in optimizing a process formula using a small number of experimental runs [39].
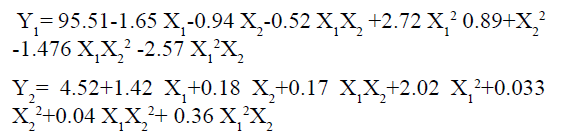
The polynomial equation generated by this experimental design using Reliasoft® DoE++ V.9.0.6 generated polynomial models including interaction and quadratic terms were generated for all the response variables using multiple linear regression analysis (MLRA) approach [39].
Y=βo+β1 X1+β2 X2+β3 X1X2+β4 X1 2+β5 X2 2+β6 X1X2 2+β7 X1 2X2
Where,
βo is the intercept representing the arithmetic average of all quantitative outcomes of 13 runs;
β1 to β7 are the coefficients computed from the observed experimental values of Y; and
X1 and X2 are the coded levels of the independent variable(s).
The terms X1X2 and Xi2 (i=1 to 2) represent the interaction and quadratic terms, respectively [22]. Statistical validation of the polynomial equation was established on the basis of ANOVA provision in the Reliasoft® DoE++ V.9.0.6 Software. Various feasibility and grid searches were conducted to find the composition of optimum formulations. Also, the 3-D response surface graphs and 2-D contour plots were constructed using the graphical output files generator.
Independent variable studied were the polymer concentration (mg) (X1), Compression Force (Tons) (X2). The dependent variable were hardness (Kg/cm2) (Y1) and cumulative drug release (%) (Y2). The concentration range of independent variable along with their low, medium and high levels, were selected based on the results from preliminary experiments.
Optimization data analysis: The response surface methodology is a collection of mathematical and statistical techniques used for modeling and analysis of problems in which a response of interest is influenced by several variable and the objectives is to optimize this response. The run or formulation, which are designed based on central composite design are evaluated for the response. The response values are subjected to multiple regressions analysis to find out the relationship between the factor used and the response value obtained [40]. The computation for optimized for optimized formulation was carried using software Reliasoft® DoE++ V.9.0.6 office. The optimized formulation was obtained by applying constraints on dependent (Response) and independent variables (Factors). The models were evaluated in terms of statistically significant coefficient and R2 values. Various feasibility and grid searches were conducted to find optimum parameters. Various 3-D response surface graphs were obtained from Reliasoft® DoE++ V.9.0.6 software.
Statistical analysis: Statistical analysis of Central composite design was performed by multiple regression analysis using Microsoft Excel. To analyze the contribution of each factor with different level to response, the two way analysis of variance (ANOVA) was performed using the Reliasoft® DoE++ V.9.0.6 software. To graphically demonstrate the influence of each factor on the response, the response surface plots were generated using the ®Reliasoft Office DOE software [41].
Checkpoint analysis: A checkpoint analysis was performed to confirm the role of the derived polynomial equation and contour plots in predicting the responses. Values of independent variables were taken at 3 points, 1 from each contour plot, and the theoretical values of PHB Concentration and Compression Force were calculated by substituting the values in the polynomial equation. Mucoadhesive Extended release tablets were prepared experimentally at 3 checkpoints and evaluated for the responses [38-41].
Characterization of PHB base Ibuprofen ER tablet
All Pre-compression characterization PHB blend: The Precompression parameters included Angle of repose, Bulk density, Tapped density, Carr’s (Compressibility) index, Hausner’s Ratio, of PHB polymer was performed [42,43].
Characterization of ER Ibuprofen tablet using PHB: General appearance, thickness, diameter and volume, tablet hardness, weight variation, uniformity of content and friability [42,43].
The physicochemical evaluation was performed according to European Pharmacopeia (1997).
The tablet thickness is expressed as averages of 5 measurements made at 5 different points between the 2 surfaces of the compact.
Hardness of the tablet of each formulation was determined using Pfizer hardness tester. Three tablets from each formulation batch were tested randomly and the average reading was noted.
Randomly selected 20 tablets were weighed individually and together in a single pan balance. As per Indian Pharmacopeia this method is satisfactory to determine the drug content uniformity. The average weight was noted and standard deviation was calculated.
The test for uniformity of drug content is carried out by collecting a sample of 10 tablets from a batch and determining their individual amount of drugs in each tablet. As per Indian Pharmacopeia this method is satisfactory to determine the average drug content and the content of individual tablets should fall within specified limits in terms of the percentage deviation from the mean.
The test for disintegration time is carried out by Nine hundred millilitres of water maintained at 37°C. DT was determined at the point at which the tablet disintegrated and passed through the screen of the sinker completely (opening of mesh of the sinker: 3-3.5 mm in height and 3.5-4 mm in width) [27].
The Roche friabiliator was used for determination of friability.
Drug content: Ten tablets from each formulation were weighed individually and powdered. The Powder equivalent to 200 mg of Ibuprofen was weighed and dissolved in 10ml of methanol and volume was adjusted to 100 ml with pH 6.8 PBS. From this solution 1 ml was taken and made up to 100 ml using same dilution media, solution was filtered, and analyzed at 222 nm by UVvisible spectrophotometer [44].
Tablet porosity: The tablet porosity was calculated from the dimensions and weight of the tablet and the apparent particle density of the mixture. The apparent density (ρapp) of the compact, were calculated from the ratio of the tablet mass to the volume of the compact [42].
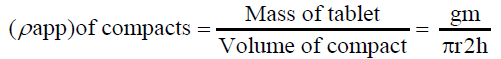
The porosity of the compacts was calculated using the relationship
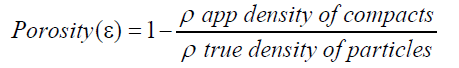
Where, ε is the porosity of the compacts, ρapp is the apparent density of the compact, and ρ true is the true density of the particles. The ratio of ρapp/ρtrue is a measure of the relative density or the solid fraction of the compact.
Tablet tensile strength: A diametric compression test was performed according to test was performed according to European Pharmacopoeia (Resistance to crushing of tablet; n=35) [43]. The tablet crushing load, which is the force required to break flat faced tablet into halves by compression in the radial direction, was measured using a tablet hardness tester. Tensile strength for crushing (Ts) was calculated using the following equation:
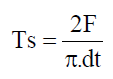
Where, F is the crushing load, and d and t denote the diameter and thickness of the tablet, respectively.
In vitro dissolution test: The in vitro release rate studies of ER tablet formulation were carried out in USP dissolution test apparatus Type II paddle type (VEEGO, Mumbai) in HCl buffer solution (pH 1.2 ± 0.1) from 0 to 2 h and potassium phosphate buffer (pH 6.8 ± 0.1) from 2 to 12 h. Rotation speed of 50 rpm at temperature of 37 ± 0.5°C and dissolution medium of 900 ml was maintained throughout the experiment. At predetermined time intervals, 5 ml of sample was withdrawn and replaced with the same volume pre-warmed (37 ± 0.5°C) fresh dissolution medium. The samples withdrawn were filtered through Whattman No. 1 filter paper, and drug content in each sample was analyzed after suitable dilution using UV/Vis spectrophotometer (UV 1800, Shimadzu) at two different wavelengths, 220 nm for samples in HCl buffer solution pH 1.2 and 222 nm for samples in potassium phosphate buffer pH 6.8 [44]. Cumulative percentage of drug release was calculated using an equation obtained from a standard curve [45,46].
Drug release kinetics (Model dependent approaches): Model dependent methods are based on different mathematical functions, which describe the dissolution profile. Once a suitable function has been selected, the dissolution profiles are evaluated depending on the derived model parameters. In order to determine the suitable drug release kinetic model describing the dissolution profile [47,48]. The release data obtained were treated according to zero-order (cumulative amount of drug release versus time), Higuchi (cumulative percentage of drug release versus square root of time), Korsmeyer-Peppas (log cumulative percentage of drug release versus log time) Weibull model (log time versus log percent drug release) equation models. Different kinetic models were applied to interpret the drug release kinetics from ER matrix system [49].
Result and Discussion
Biosynthesis of PHB
Screening and characterization of Biopolymer from microbial source: Soil samples were collected near from Biotechnology department TKIET campus, Warananagar. It was found to be loamy and blackish in colour. Isolation and purification of bacterial strains from soil sample was carried out [23]. It were reported that 19 different viable colonies are produced on Nutrient agar plate with time span of 24 hours at 30°C.
Screening for PHB producing bacterial strains: It was found that, out of 19 isolated colonies, 6 showed morphologically distinct characteristics were flooded with Sudan black-B solution. The obtained cell mass from plates was then confirmed by Nile blue staining technique and Volutin Granule staining method. These both staining technique showed positive feedback for intra-granular PHB production.
Harvesting of cellular biomass: shows the dry weight of biomass per 100 ml of nutrient media of the soil isolate and the standard organism Bacillus megaterium obtained from agar and broth medium. The all bacterial strains were capable of PHB synthesis. Bacteria accumulate maximum PHB during the stationary phase, in nutrient broth medium PHB yield become limited as compare to stationary phase due to nutrients availability becomes critical after some time period that reason was took into account and nutrient agar medium was selected for further studies. The lowest amounts of biomass showed by soil isolate SS2 that was 36 mg and 21 mg in nutrient agar and nutrient broth respectively [24]. Soil isolate SS5 showed 136 mg and 88 mg in nutrient agar and nutrient broth respectively (Table 1). By considered other view of production standard PHB producer Bacillus megaterium yields 250 mg of biomass which was greater than biomass yielded by other soil isolates organism hence that standard organism was selected for further production.
| Isolate Code | Dry weight of biomass per 100 mL media (mg) | |
|---|---|---|
| Agar | Broth | |
| SS1 | 119 | 73 |
| SS2 | 36 | 21 |
| SS3 | 52 | 23 |
| SS4 | 187 | 93 |
| SS5 | 136 | 88 |
| SS6 | 88 | 45 |
| BM | 253 | 148 |
| BM : Bacillus megaterium | ||
Table 1. Dry weight of obtained cellular biomass
Extraction of PHB: Nutrient agar was selected as the medium for maximum PHB yield. When all the bacterial isolates were grown on nutrient agar medium they produced various amount of PHB yield. The isolate SS4 was yielded least amount of PHB yield 6% w/w dry cell weight while, at the same time other isolates SS1, SS2, SS3, SS5, SS6, yielded 12, 9, 11, 15, 14% w/w of dry cell weight respectively (Table 2). On other hand selected standard bacterial producer Bacillus megaterium yielded 18% w/w of dry cell weight.
| Isolate | PHB yield/ dry cell weight (% w/w) |
Isolate | PHB yield/ dry cell weight (% w/w) |
|---|---|---|---|
| SS1 | 12 | BM1 | 22 |
| SS2 | 9 | BM2 | 28 |
| SS3 | 11 | BM3 | 36 |
| SS4 | 6 | BM4 | 27 |
| SS5 | 15 | BM5 | 32 |
| SS6 | 14 | BM6 | 41 |
| BM | 18 |
Table 2. PHB Yield showed by Bacillus megaterium on nutrient agar and BM specific Media
The specific media for Bacillus megaterium required for optimum production of PHB were attained from literature. From Table 2 it was found that standard Bacillus megaterium strains grown on BM specific medium they produced various extent of PHB yield. The least PHB yield showed by BM1 that was found to be 22% w/w dry cell weight which consisted 1.5% of glucose and 0.1% of peptone concentration. While maximum PHB yield showed by BM3 that was found to be 36% w/w dry cell weight at 3.5% glucose and 0.3% of peptone in media composition contained commercial carbon and nitrogen Source. At same time PHB yield produced by media composition contained cheaply available carbon and nitrogen source. The yield of BM6 was found to be 27% w/w dry cell weight obtained from media containing 1.5% of molasses and 0.1% of ammonium chloride that was least yield, while 41% w/w dry cell weight of maximum yield obtained from BM6 that was found to be maximum yield as compare to yield obtained from all other media compositions. So BM6 was selected as potential PHB producer on large scale production [21].
Drug Interactions with PHB
Infra-red spectral analysis: Drug -excipients compatibility parameter took into account because it was directly affect the formulations stability and its potential effect on pharmacologic properties of drug candidate on living system. Drug-excipients compatibility confirmed by FT-IR spectroscopy is illustrated in Figure 1. Ibuprofen and physical mixture consisted polymer were took into account. The spectrum was recorded of Ibuprofen at 1419 cm-1, 1230 cm-1, 1380 cm-1, 1702 cm-1, 1321 cm-1 and 3090 cm-1. Ibuprofen shows peak at 1419 cm-1 corresponds to C-H stretch of the alkenes compound present in the structure. The same peak was aroused in the physical mixture at 1419 cm-1 .The peak at 1230 cm-1 corresponds to C-C(O)C group represents the esters of acetate compound in ibuprofen; same peak for esters of acetate compound showed by physical mixture at 1230 cm-1. C-N stretch was showed at 1321 cm-1 in the ibuprofen while at the same position, physical mixture aroused same stretch in the structure. PHB yields the C-H stretching at position 2982 cm-1 the same peak aroused at 2982 cm-1 so these peak assignments proved that there were no possible interactions between drug, polymer and drug and polymer excipient physical mixture (Figure 1) [25,26].

Figure 1. FTIR spectra of PHB, Ibuprofen and Physical mixture
Differential Scanning calorimetry: DSC thermogram of physical mixture of drug showed sharp endothermic peak at 77.77°C that analogous to the melting point temperature of ibuprofen (77.25°C). Physical mixture of all above ingredient their identical peaks at defined temperature range. Presence of all peaks indicates that all ingredients are compatible with drug substance means there were no incompatibility between selected ingredients for formulation (Figure 2) [28].

Figure 2. Differential scanning calorimetry (DSC) thermogram of physical mixture containing Ibuprofen and PHB
PHB based extended release Ibuprofen tablet
The ER tablet consists of the most obvious factor that showed impact on drug dissolution rate and bioavailability of less aqueous soluble drug candidate. Therefore, three key factors for successful tableting are flow and compactability of the compression mix, and drug content uniformity in the mix and the final tablets. All of these factors are likely to be maintained for better formulation aspect [30,31]. Therefore, formulation strategy took into account and it had become duty to selection of an ideal component for better tableting process. Imminent particle size of preformulated material had also help to minimize segregation of the finely milled drug from the compression mix. It had been observed excipients with a rough surface can interact more strongly with drug particles than a smooth surface excipient [32,33]. Good flow and compaction of the compression mix are largely conferred by the excipients and the primary concern was likely to be achievement of good content uniformity in the blend and in the tablets formulation.
In direct compression technique the finely milled filler binders have been used to exhibit sufficient flow for direct compression and a glidant had used in powder blend to reduce interference with flow. Colloidal silicon dioxide added that improved the flow characteristics of a compression mix [33].
Pre- Compressional Behavior of PHB: Selections of appropriate premixed material were the key of direct compression. Therefore, specially designed Lactose monohydrate (Lactopress®) was selected as filler in the formulation that had comprised of benefitted quality like unique particle size less than 100 μm that added functionality improved flow ability with compactability properties in the formulation. Lactose is mostly used filler in vast range of tablet formulation which enabled with formulation compatibility and universal stability of the product. Screened PHB was added in the formulation as release retardant polymer which exhibited prolonged drug release [34]. All the used material was free flowing, tablet were obtained of uniform weight variation as per pharmacopoeia specifications. Bulk density was found to be between 0.52 ± 0.01 to 0.72 ± 0.02 gm/mL and tapped density was found to be between 0.72 ± 0.02 to 0.88 ± 0.01 gm/mL for all formulations (). From obtained density data % compressibility was calculated and that was found to be between 5.8 ± 0.082 to 26.4 ± 0.044 percent. Angle of repose was found to be in the range of 22.14 ± 0.58 to 34.62 ± 0.33 (Table 3).
| Formulation Code | Angle of repose (Ɵ) | Bulk Density (gm/mL) | Tapped Density (gm/mL) | Carr’s Index (%) | Hausner’s Ratio |
|---|---|---|---|---|---|
| F-1 | 30.02 ± 0.13 | 0.52 ± 0.01 | 0.57 ± 0.02 | 8.7 ± 0.038 | 1.10 |
| F-2 | 32.46 ± 0.34 | 0.64 ± 0.01 | 0.72 ± 0.01 | 11.1 ± 0.092 | 1.14 |
| F-3 | 29.63 ± 0.47 | 0.62 ± 0.01 | 0.74 ± 0.01 | 16.5 ± 0.012 | 1.00 |
| F-4 | 22.14 ± 0.58 | 0.59 ± 0.01 | 0.72 ± 0.02 | 18.4 ± 0.086 | 1.23 |
| F-5 | 27.54 ± 0.88 | 0.56 ± 0.03 | 0.63 ± 0.01 | 11.6 ± 0.036 | 1.12 |
| F-6 | 30.51 ± 0.16 | 0.67 ± 0.01 | 0.73 ± 0.02 | 8.06 ± 0.019 | 1.09 |
| F-7 | 31.44 ± 0.56 | 0.53 ± 0.04 | 0.64 ± 0.03 | 17.7 ± 0.082 | 1.21 |
| F-8 | 32.88 ± 0.99 | 0.70 ± 0.01 | 0.78 ± 0.01 | 10.8 ± 0.090 | 1.11 |
| F-9 | 26.56 ± 0.02 | 0.72 ± 0.01 | 0.76 ± 0.03 | 7.3 ± 0.082 | 1.07 |
| F-10 | 33.48 ± 0.27 | 0.65 ± 0.03 | 0.88 ± 0.01 | 26.4 ± 0.044 | 1.34 |
| F-11 | 29.23 ± 0.13 | 0.72 ± 0.02 | 0.81 ± 0.01 | 11.3 ± 0.021 | 1.13 |
| F-12 | 34.62 ± 0.33 | 0.63 ± 0.03 | 0.77 ± 0.02 | 18.1 ± 0.045 | 1.21 |
| F-13 | 27.77 ± 0.96 | 0.56 ± 0.01 | 0.63 ± 0.01 | 11.3 ± 0.043 | 1.13 |
Table 3. Precompression Characterization of PHB based powder Blend
A standard value stand for Hausner’s ratio less than 1.20 is indication of good flow ability of material, whereas value of 1.5 or higher represents the poor flow ability of material. Exceptionally few formulations cross the limit value of Hausner’s ratio. The Carr’s index is also known as compressibility index. A values stands between 5 and 15, 12 and 16, 18 and 21 and 23 and 28 indicates excellent, good, fair, and poor flow properties of the material respectively (Table 3).
Kawakita plot: The compaction properties of pharmaceutical powders are characterized by their compressibility and compactability. While compressibility is the ability of the powder to deform under pressure, compactability is the ability to form mechanically to strong compacts. Compaction as applicable to pharmaceutical powder consists of the simultaneous process of compression and consolidation of two phase (particulate solid gas) system due to an applied force [35,36]. ‘a’ is properties of consolidation as close packing and ‘b’ is packing velocity. The constant ‘a’ is equal to the minimum porosity of the bed prior to compression while ‘b’ which is termed as the coefficient of compression, is related to the plasticity of the material (Table 4). Greater the value of ‘b’ indicate good compactability, and if packing velocity is high means yield pressure are breaking strength is less. All the formulations indicate the good flow ability but at the same time it shows the poor compactability. The Kawakita elucidating the flow of powder blend shown in Table 4.
| Formulation Code | a | b |
|---|---|---|
| F-1 | 0.305 | 0.037 |
| F-2 | 0.279 | 0.040 |
| F-3 | 0.256 | 0.048 |
| F-4 | 0.282 | 0.043 |
| F-5 | 0.256 | 0.048 |
| F-6 | 0.292 | 0.035 |
| F-7 | 0.243 | 0.048 |
| F-8 | 0.292 | 0.038 |
| F-9 | 0.279 | 0.040 |
| F-10 | 0.264 | 0.051 |
| F-11 | 0.281 | 0.036 |
| F-12 | 0.305 | 0.039 |
| F-13 | 0.317 | 0.041 |
Table 4. Flow characterization of PHB based powder Blend
Design of experiment
The implementation of Design of Experiments (DoE) optimization techniques invariably encompasses use of experimental designs and generation of mathematical equations and graphic outcomes, thus depicting an inclusive picture of variation of the product/process response (s) as a function of input variable.
Response surface methodology (RSM) is a rapid technique used to empirically derive a functional relationship between an experimental response and a set of input variables in the development and optimization of drug delivery systems. RSM trim down the number of experimental runs that are necessary to establish a mathematical trend in the experimental design region allow to determine the optimum level of experimental factors required for a given response [37-40].
Central composite design: Central composite design is very efficient and flexible, providing much information on experiment variable effects and overall percentage error in a minimal number of experimental runs. Based on the principles of design of experiments (DoE), the methodology involves the use of various types of experimental designs, generation of polynomial mathematical relationships and mapping of the response over the experimental domain to select the optimum formulation. Therefore, central composite design was found to be a very suitable tool for process optimization of pharmaceutical formulations [38- 41]. Systematic optimization procedures are carried out by selecting an objective function, finding the most important or contributing factors and investigating the relationship between responses and factors by the so called response surface methodology.
Optimization data analysis: A central composite statistical design with 2 factors, 3 levels and 13 run was selected to study the effects on dependent variables. All the batches of prepared powder blend were within the experimental design yielded tablets and these tablets were evaluated for hardness, cumulative percent drug release. The Central composite design gained popularity due to fewer experiment (13 runs) wants to perform. Transformed values all the batches shown in. The all selected dependent variable obtained at various levels of 2 independent variables (X1 and X2) were subjected to multiple regression to yield second order polynomial equation.
Effect of Formulation variables: The range of formulation component with constraints was applied to check the effects of formulation variables on responses. Cumulative drug release (%) and hardness (Kg/cm2) parameter were selected to get desired goal of effective formulation. Formulation variables had impact on responses showed by wide range value obtained from coefficient of term polynomial equations.
Cumulative percent drug release (Y1) strongly affected by employed formulation variable. The main effect of X1 and X2 represents the result of changing the proportion of variable from its low level to high level. The interaction terms (X1X2, X2 2, X1X2 2, and X1 2X2) shows how the cumulative percent drug release changes when remained variables are simultaneously changed. The negative coefficients for independent variable indicate an unfavorable effect on drug release. The positive coefficients for the interaction between two variables indicate favorable on drug release. Among the two independent variables the lowest coefficient value is found for X2, indicating that this variable is insignificant in prediction of hardness.
Y1 and Y2 values measured for the different batches showed wide variation of values ranged from 88.99 to 98.29% for Y1 (Figures 3-6 and Figure 8) and 2.56 to 7.57 kg/cm2 for Y2 (Figures 9-11 and Figure 13), which is clearly indicate that that Y1 and Y2 value strongly affected by the variables preferred for the optimization study (Tables 5 and 6). The variables also showed impact on other formulation parameters. The main effect produced by X1 and X2 variables represents the average result of changing one variable at a time from its low level to high level. The negative sign in polynomial equation indicate negative effect on response while positive sign indicate positive effect. The statistical analysis of full model (Tables 7 and 8) shows that the independent variables had a significant effect on the responses.

Figure 3. Normal probability plot for effect of cumulative drug release (%) on Poly(3-hydroxybutyrate) base ibuprofen ER tablet

Figure 4. Probability plot for residual of cumulative drug release (%) on Poly(3-hydroxybutyrate) base ibuprofen ER tablet

Figure 5. Plot for residual versus fitted value of cumulative drug release (%) on Poly (3-hydroxybutyrate) base ibuprofen ER tablet

Figure 6. Fitted versus actual values of cumulative drug release (%) on Poly (3-hydroxybutyrate) base ibuprofen ER tablet

Figure 7. Pareto chart showing the standardized effect of independent variables and their interaction on cumulative drug release (%) on Poly (3-hydroxybutyrate) base ER tablet

Figure 8. Interaction matrix of concentration of dependent variable on cumulative drug release (%) on Poly (3-hydroxybutyrate) base ibuprofen ER tablet

Figure 9. Normal probability plot for effect of hardness (Kg/cm2) on Poly (3-hydroxybutyrate) base ibuprofen ER tablet

Figure 10. Probability plot for residual of hardness (Kg/cm2) on Poly(3-hydroxybutyrate) base ibuprofen ER tablet

Figure 11. Plot for residual versus fitted value of hardness (Kg/cm2) on Poly (3-hydroxybutyrate) base ibuprofen ER tablet

Figure 12. Pareto chart showing the standardized effect of independent variables and their interaction on hardness (Kg/ cm2) on Poly (3-hydroxybutyrate) base ER tablet

Figure 13. Interaction matrix of concentration of dependent variable on hardness (Kg/cm2) on Poly (3-hydroxybutyrate) base ibuprofen ER tablet
| Run order/ Batch N0 | Independent variable | |||
|---|---|---|---|---|
| PHB concentration (Mg) (X1) | Compression Force (Tons) (X2) | |||
| 1 | -1 | 1 | ||
| 2 | 0 | -1.41 | ||
| 3 | 0 | 0 | ||
| 4 | -1.41 | 0 | ||
| 5 | 0 | 0 | ||
| 6 | 0 | 0 | ||
| 7 | 0 | 1.41 | ||
| 8 | 0 | 0 | ||
| 9 | 1 | -1 | ||
| 10 | 1.41 | 0 | ||
| 11 | 1 | 1 | ||
| 12 | 0 | 0 | ||
| 13 | -1 | -1 | ||
| Independent variables | Low | Medium | High | |
| A=Concentration of PHB (mg) | 40 | 50 | 60 | |
| B=Compression Force (Tons) | 0.25 | 0.375 | 0.5 | |
| Dependent variables (Responses) | ||||
| Y1=Cumulative drug release (%) Y2=Hardness (Kg/cm2) |
||||
Table 5. Central composite experimental design for preparation of Poly(3-hydroxybutyrate) base ibuprofen ER tablet