Review Article - Allied Journal of Medical Research (2021) COVID-19 in the context of Medical Research
Nonalcoholic fatty pancreatic disease : Is it mirror to NAFLD
Reda Mohamed Albadawy*
Department of Gastroenterology, Banha university, Benha, Egypt
- Corresponding Author:
- Reda Mohamed Albadawy
Department of Gastroenterology
Hepatology and Infectious Diseases
Banha University
Banha, Egypt
E-mail: reda.albadawy@fmed.bu.edu.eg
Accepted date: December 18, 2020
Citation: Albadawy RM. Nonalcoholic fatty pancreatic disease: Is it mirror to NAFLD. 2021;5(1): 85-92.
Abstract
Background: The pancreas and the liver are organs in which fat is most easily deposited. Nonalcoholic fatty pancreas disease (NAFPD) comprises a wide spectrum of diseases from deposition of fat in the pancreas (fatty pancreas, pancreatic steatosis), to pancreatic inflammation (non-alcoholic steatopancreatitis), pancreatic fibrosis and pancreatic adenocarcinoma. Aim: The aim was to study the association between Non Alcoholic Fatty Pancreas Disease (NAFPD) and Non Alcoholic Fatty Liver Disease (NAFLD).
Methods: This study was conducted on 100 subjects (50 patients with sonographically proven NAFLD and 50 normal individuals selected from 165 subjects). Full history taking, clinical examination, routine laboratory and abdominal ultrasound were done.
Results: Concurrence of NAFPD and NAFLD on abdominal ultrasound was found in 38/50 patients (76%). There was statistically significant association of NAFLD with fatty pancreas severity. The present study revealed significant associations of fatty pancreas with aging, obesity, type 2 Diabetes mellitus (T2DM), and dyslipidemia (higher levels of cholesterol, low density lipoprotein (LDL), high density lipoprotein (HDL), very low density lipoprotein (VLDL), triglycerides, cholesterol/ HDL (Risk I), LDL/HDL (Risk II).
Conclusion: Fatty pancreas is a common finding during medical check-up and has significant association with NAFLD and other metabolic factors. Fatty pancreas could be an initial indicator of ectopic fat deposition and an earlier manifestation of metabolic syndrome than fatty liver.
Keywords
Fatty pancreas, Fatty liver, Dyslipidemia, Type 2 diabetes mellitus.
Abbreviations
NAFPD: Nonalcoholic Fatty Pancreas Disease; NAFLD: Non Alcoholic Fatty Liver Disease; T2DM: Type 2 Diabetes Mellitus; LDL: Low-Density Lipoprotein; HDL: High-Density Lipoprotein; VLDL: Very Low Density Lipoprotein.
Introduction
Non Alcoholic Fatty Liver Disease (NAFLD) is characterized by hepatic triglyceride accumulation not due to alcohol consumption (<20 gram ethanol per day), resulting in steatosis and hepatic inflammation [1]. Non Alcoholic Fatty Pancreas Disease (NAFPD) is an excessive lipid accumulation in the pancreas in the absence of significant alcohol intake [2]. NAFPD may allegedly develop into chronic pancreatitis and further leads to pancreatic cancer, and facilitates its dissemination. The ratio of fatty degeneration in pancreas with pancreatic ductal adenocarcinoma (PDAC) was higher than for pancreas without PDAC (72% vs. 44%) [3-5].
This condition was first described in 1926, later in 1933 the term ‘pancreatic lipomatosis’ was used to represent the pathological process of excessive fat storage in the pancreas. To date, the pathophysiology of NAFPD remains unclear. There are two potential mechanisms for pancreatic fat accumulation: (i) death of acinar cells, followed by the replacement of adipose tissue; and (ii) intracellular triglyceride accumulation associated with excessive energy balance [6-8].
Prevalence of NAFPD has been reported in Asia as well as in western countries. In Taiwan, one study reported that 16% of Chinese population had fatty pancreas [9] and another study in USA. USA reported that as high as 27.8% of the patients who underwent Endoscopic Ultrasound Evaluation (EUS) had NAFPD [10]. In Indonesia, which represents the biggest Southeast Asian country, the prevalence of NAFPD in the medical check-up population was 35% [11]. In Egypt, no studies done till now. Non Alcoholic Fatty Pancreas Disease (NAFPD) is usually an incidental finding during trans-abdominal ultrasound examination. The aim of the study was to determine the association between Non Alcoholic Fatty Pancreas Disease (NAFPD) and Non Alcoholic Fatty Liver Disease (NAFLD).
Subjects and Methods
This case control study was conducted on 100 subjects (50 patients with sonographically proven NAFLD and 50 normal individuals) at Hepatology, gastroenterology and infectious diseases department, faculty of Medicine, Benha University in period from October 2018 to June 2019. Written informed consent was taken from all patients for participation in this study and local ethical committee of Benha faculty of medicine, Benha University. The studied population was divided as follow:
Group Ι: Included 50 individuals with sonographically proven NAFLD (18 males and 32 females with mean age 45.64 ± 9.82 years).
Group ΙΙ: Included 50 healthy individuals with no sonographic evidence of NAFLD (18 males and 32 females with mean age 39.42 ± 10.84 years). All participants were subjected to thorough history taking, full clinical examination including measurement of arterial blood pressure and calculation of the body mass index (BMI), laboratory investigations including Complete Blood Count (CBC), fasting blood glucose, liver biochemical tests including serum Alanine Aminotransferase (ALT), serum Aspartate Amino Transferase (AST), total serum bilirubin and direct serum bilirubin, serum albumin, Alkaline Phosphatase (ALP), Gamma-Glutamyl Transpeptidase (GGT), kidney function tests including serum creatinine and blood urea, lipid profile including total cholesterol, low density lipoprotein (LDL), High Density Lipoprotein (HDL), Very Low Density Llipoprotein (VLDL), triglycerides, cholesterol/HDL (Risk I), LDL/HDL (Risk II) and abdominal ultrasonography for diagnosis of fatty liver, fatty pancreas and grading them by GE healthcare LOGIQ E9 machine. The liver echogenicity was classified into 4 grades [12]:
Grade 0: Normal liver echogenicity.
Grade 1: A slight increase in liver echogenicity with no attenuation in the far field.
Grade 2: A moderate increase in liver echogenicity with light attenuation in the far field and the diaphragm and vessels clearly visible.
Grade 3: A substantial increase in liver echogenicity with poor visualization of the diaphragm and the vessels.
NAFLD was diagnosed when the liver appeared as grade 1 to 3.
The pancreas echogenicity was also classified into 4 grades [13,14]:
Grade 0: The pancreas echogenicity was similar to the kidney parenchymal.
Grade 1: Pancreas echogenicity was slightly higher than in the kidney, but because the pancreas and kidney could not be displayed in the same screen, the radiologist compared the kidney with the liver and then compared the liver with the pancreas.
Grade 2: A substantial increase in pancreas echogenicity but lower than the retroperitoneal fat echogenicity.
Grade 3: The pancreas echogenicity was similar to or higher than the retroperitoneal fat. NAFPD was diagnosed when the pancreas appeared as grade 1 to 3.
Statistical Analysis
The clinical data were recorded on a report form. These data were tabulated and analyzed using the computer program SPSS (Statistical package for social science) version 20 to obtain: Descriptive data and Analytical statistics.
Descriptive statistics were calculated for the data in the form of:
1. Mean and standard deviation (±SD). Median and interquartile range (IQR) for quantitative data.
2. Frequency and distribution for qualitative data.
Analytical Statistics
In the statistical comparison between the different groups, the significance of difference was tested using one of the following tests:-
1-ANOVA test (F value) and kruskal-wallis test:-used to compare mean of more than two groups of quantitative data of parametric and non-parametric respectively.
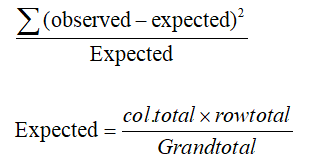
Inter-group comparison of categorical data was performed by using chi square test (X2-value) and fisher exact test (FET).
A P value<0.05 was considered statistically significant (*) while >0.05 statistically insignificant P value<0.01 was considered highly significant (**) in all analyses.
Results
There was highly statistical significant difference between the studied groups regarding age and Body Mass Index (BMI) (Table 1). Mean age and BMI were significantly higher in group I compared to group II (Table 1).There were statistical significant differences between the studied groups regarding HOMA-IR, hemoglobin and platelet count and no statistical significant differences between the studied groups regarding fasting blood sugar, fasting insulin levels and white blood cells (WBCs) count (Table 2). HOMA-IR was significantly higher in group I compared to group II (Table 2). There was no statistical significant difference between the studied groups regarding liver profile except for Gamma-Glutamyl Tranferase GGT with p<0.001 (Table 3). GGT levels were significantly higher in group I compared to group II (p<0.001) (Table 3). There were highly statistical significant differences between the studied groups regarding serum triglycerides (TG) and VLDL levels and no statistical significant difference as regards other variables (Table 4). Serum triglycerides and VLDL levels were significantly higher in group I compared to group II (Table 4). There was statistical significant difference between the studied groups regarding presence of sonographic evidence of fatty pancreas (Table 5). Fatty pancreas was noted in 38 patients (76.0%) with NAFLD (group I) compared to 28 healthy individuals (group II) (56.0%) (p=0.035) (Table 5). Also, there was highly statistical significant difference between the studied groups regarding grade III of fatty pancreas. Fatty pancreas grade III was noted in 26 patients (52.0%) with NAFLD (group I) compared to 10 healthy individuals (group II) (20.0%) (p<0.001) (Table 5). The two studied groups were subdivided into NAFPD group and non NAFPD group according to presence of sonographic evidence of fatty pancreas. There was no statistically significant difference between the studied groups regarding sociodemographic criteria except for age and BMI(Table 6). There was highly statistical significant difference between the studied groups regarding BMI and statistical significant difference between the studied groups regarding age (Table 6). Mean age and BMI were significantly higher in NAFPD group compared to non NAFPD group (Table 6). There was no statistical significant difference between the studied groups regarding liver profile except for GGT with p=0.009 (Table 7). GGT levels were significantly higher in NAFPD group compared to non NAFPD group (p=0.018) (Table 7). There were highly statistical significant differences between the studied groups regarding serum cholesterol, triglycerides, LDL, VLDL levels and cholesterol/HDL ratio, statistical significant difference as regards LDL/HDL ratio and no statistical significant difference as regards HDL level (Table 8). Serum cholesterol, triglycerides, LDL, VLDL levels, cholesterol/HDL and LDL/HDL ratios were significantly higher in NAFPD group compared to non NAFPD group (Table 8).
| Group I (50) (NAFLD) | Group II (50) (Non NAFLD) | Statistical test | P-value | |
|---|---|---|---|---|
| Sex | ||||
| Male Female |
18(36.0%) 32(64.0%) |
18(36.0%) 32(64.0%) |
FET= 0.0 | 1.0 |
| Age (year) | 45.64 ± 9.82 | 39.42 ± 10.84 | St t=3.09 | 0.003** |
| Special habits | ||||
| NO smoking |
42(84.0%) 8(16.0%) |
38(76.0%) 8(16.0%) |
FET=3.94 | 0.17 |
| Contraceptive pills | 0(0.0%) | 4(8.0%) | ||
| Residence | ||||
| Rural urban |
22(44.0%) 28(56.0%) |
38(76.0%) 12(24.0%) |
X2=10.67 | 0.001** |
| Weight (kg) | 88.68 ± 13.74 | 78.64 ± 11.01 | St t=4.03 | 0.001** |
| Height (cm) | 167.88 ± 10.15 | 165.76 ± 7.9 | St t=1.17 | 0.25 |
| BMI median (IQR) |
30.5(27.78-35.43) | 27.3(25.88-31.25) | MW=3.15 | 0.002** |
Abbreviations: BMI: Body Mass Index; FET: Fisher Exact Test; St t: Student’s t –test; X2: Chi Square Test; MW: Mann–Whitney U test; IQR: Inter-Quartile Range.**: Highly significant.
Table 1. Sociodemographic criteria among the study groups.
| Group I (50) (NAFLD) | Group II (50) (Non NAFLD) | Statistical test | P-value |
|
|---|---|---|---|---|
| FBS (mg/dl) median (IQR) |
89(81.5-123.25) |
89(83.75-96.25) |
MW=1.41 | 0.16 |
Fasting insulin (uIU/mL) median (IQR) |
4.59(4.31-5.08) |
4.44(4.21-4.84) |
MW=1.16 | 0.25 |
HOMA-IR |
1.1(0.98-1.5) |
1.0(0.9-1.2) |
MW=2.18 | 0.03* |
Hemoglobin (gm/dl) |
13.62 ± 1.43 |
12.75 ± 1.87 |
St t=2.64 | 0.01* |
WBCs (103c/mm3) |
6.39 ± 1.79 |
6.55 ± 2.83 |
St t=0.33 | 0.74 |
Platelets (103c/mm3) |
224.72 ± 67.35 |
263.84 ± 75.65 |
St t=2.73 | 0.007** |
Abbreviations: HOMA-IR: Homeostatic Model Assessment for Insulin Resistance; WBCs: White Blood Cells count; St t:
Student’s t –test; MW: Mann–Whitney U test; IQR: Inter-Quartile Range.
*: Statistically significant; **: Highly significant.
Table 2. Laboratory findings of the study groups.
| Group I (50) (NAFLD) | Group II (50) (Non NAFLD) | Statistical test | P-value |
|
|---|---|---|---|---|
ALT (IU/L) |
16(12-21) |
16(13-20.25) |
MW=0.28 | 0.78 |
AST (IU/L)(M ± SD) |
23.88 ± 6.31 |
22.24 ± 6.72 |
St t=1.26 | 0.21 |
Total bilirubin (mg/dl) median (IQR) |
0.5(0.4-0.6) |
0.5(0.4-0.7) |
MW=0.23 | 0.82 |
| S. albumin (gm/dl) median (IQR) |
5(5-5) |
5(4.79-5) |
MW=1.5 | 0.13 |
ALP (IU/L) |
128.08 ± 46.11 |
140.2 ± 50.31 |
St t=1.26 | 0.21 |
| GGT (IU/L) median (IQR) |
21(17.75-29) |
13(9-18) |
MW=5.11 | 0.001** |
Abbreviations: ALT: Alanine Transaminase; AST: Aspartate Transaminase; ALP: Alkaline Phosphatase; GGT: Gamma-Glutamyl Tranferase; St t: Student’s t –test; MW: Mann–Whitney U test; IQR: Inter-Quartile Range. **: Highly significant.
Table 3. Liver profile of the study groups.
| Group I (50) | Group II (50) | Statistical test | P-value | |
|---|---|---|---|---|
| Cholesterol (mg/dl) | 185.36 ± 51.62 | 180.28 ± 53.35 | St t=0.48 | 0.63 |
| TG (mg/dl) median (IQR) |
130(93.75-195.75) | 77(65-115.5) | MW=3.83 | 0.001** |
| LDL (mg/dl) median (IQR) |
99(88.2-135.3) | 119.8(75.6-161.95) | MW=0.58 | 0.56 |
| HDL (mg/dl) median (IQR) |
35(31.25-42.25) | 33(30-41.25) | MW=0.33 | 0.74 |
| VLDL (mg/dl) median (IQR) |
26(18.75-39.15) | 15.4(13.65-23.1) | MW=3.81 | 0.001** |
| Cholesterol/HDL median (IQR) | 4.65(3.55-6.16) | 4.53(3.4-6.62) | MW=0.11 | 0.91 |
| LDL/HDL | 3.38±2.06 | 3.69±1.98 | St t=0.75 | 0.45 |
Abbreviations: TG: Triglycerides; LDL: Low Density Lipoprotein; HDL: High Density Lipoprotein; VLDL: Very Low Density
Lipoprotein; St t: Student’s t –test; MW: Mann–Whitney U test; IQR: Inter-Quartile Range.
**: Highly significant.
Table 4. Lipid profile of the study groups.
| Group I (50) | Group II (50) | Statistical test (z) | P-value | |
|---|---|---|---|---|
| Total fatty pancreas | 38 (76.0%) | 28 (56.0%) | 2.11 | 0.035* |
| Grade I | 8 (16.0%) | 10 (20.0%) | 0.52 | 0.60 |
| Grade II | 4 (8.0%) | 8 (16.0%) | 1.23 | 0.22 |
| Grade III | 26 (52.0%) | 10 (20.0%) | 3.33 | <0.001** |
Note: *: Statistically significant; **: Highly significant
Table 5. Lipid profile of the study groups.
| Total subjects (100) | NAFPD (66/100) (In both NAFLD &Non NAFLD) |
Non NAFPD (34/100) (In both NAFLD &Non NAFLD) |
Statistical test | P-value |
|---|---|---|---|---|
| Sex | ||||
| Male female |
24(36.4%) 42(63.6%) |
12(35.3%) 22(64.7%) |
X2=0.011 | 0.92 |
| Age (year) | 44.15 ± 10.24 | 39.12 ± 11.17 | St t=2.26 | 0.026* |
| Special habits | ||||
| NO Smoking Contraceptive pills> |
54(81.8%) 10(15.2%) 2(3.0%) |
26(76.5%) 6(17.6%) 2(5.9%) |
FET= 0.89 | 0.69 |
| Residence | ||||
| Rural urban |
36(54.5%) 30(45.5%) |
24(70.6%) 10(29.4%) |
X2=2.41 | 0.12 |
| BMI median (IQR) |
30.4(27.45-35.65) | 27.3(25.88-29.33) | MW=3.64 | 0.001** |
Abbreviations: BMI: Body Mass Index; FET: Fisher Exact Test; St t: Student’s t –test; X2: Chi Square Test; MW: Mann–Whitney
U test; IQR: Inter-Quartile Range.
*: Statistically significant; **: Highly significant
Table 6. Relation between sociodemographic data and NAFPD.
| Group I+II (100) | NAFPD (66/100) (In both NAFLD and Non NAFLD) |
Non NAFPD (34/100) (In both NAFLD &Non NAFLD) |
Statistical test | P value |
|---|---|---|---|---|
| ALT (IU/L) Median (IQR) |
16(13-21.75) | 16(12.75-17.75) | MW=1.01 | 0.31 |
| AST (IU/L) | 23.76 ± 7.05 | 21.71 ± 5.24 | St t=1.5 | 0.14 |
| T bilirubin (mg/dl) median (IQR) | 0.5(0.4-0.63) | 0.5(0.48-0.63) | MW=0.68 | 0.50 |
| S. albumin (gm/dl) median (IQR) |
5.0(4.83-5.0) | 5.0(5.0-5.0) | MW=1.79 | 0.074 |
| ALP (IU/L) | 136.94 ± 45.27 | 128.71 ± 54.26 | St t=0.80 | 0.42 |
| GGT (IU/L) Median (IQR) |
19(13.75-24.5) | 14(11.25-21.25) | MW=2.61 | 0.009** |
Abbreviations: ALT: Alanine Transaminase; AST: Aspartate Transaminase; ALP: Alkaline Phosphatase; GGT: Gamma-Glutamyl
Tranferase; St t: Student’s t –test; MW: Mann–Whitney U test; IQR: Inter-Quartile Range.
**: Highly significant.
Table 7. Liver profile of the study groups (with and without NAFPD).
| Group I+II (100) | NAFPD (66/100) (In both NAFLD and Non NAFLD) |
Non NAFPD (34/100) (In both NAFLD &Non NAFLD) |
Statistical test | P value |
|---|---|---|---|---|
| Cholesterol (mg/dl) |
195.21 ± 51.92 | 158.76 ± 44.62 | St t=3.48 | 0.001** |
| TG (mg/dl) median (IQR) |
123(93.75-180.25) | 71(59-100.5) | MW=4.34 | 0.001** |
| LDL(mg/dl) median(IQR) |
119.8(90.05-169.6) | 97.5(75.85-126.5) | MW=2.49 | 0.001** |
| HDL(mg/dl) median (IQR) |
34(29.75-42.25) | 35(31.75-41.25) | MW=0.85 | 0.40 |
| VLDL(mg/dl) median (IQR) |
24.6(18.75-36.05) | 14.2(12.1-20.1) | MW=4.22 | 0.001** |
| Cholesterol/HDL median (IQR) | 5.31(4.11-6.8) | 3.8(3.37-5.58) | MW=2.71 | 0.007** |
| LDL/HDL | 3.86± 2.26 | 2.9± 1.22 | St t=2.29 | 0.024* |
Abbreviations: TG: Triglycerides; LDL: Low Density Lipoprotein; HDL: High Density Lipoprotein; VLDL: Very Low Density Lipoprotein; St t: Student’s t –test; MW: Mann–Whitney U Test; IQR: Inter-Quartile Range.
Table 8: Lipid profile of the study groups (with and without NAFPD).
Discussion
The pancreas and the liver are organs in which fat is most easily deposited [15]. It has been reported a prevalence of NAFPD (16%) in the general adults with an increase of this percentage in obese subjects with fatty liver [9]. In the current study, concurrence of NAFPD and NAFLD on abdominal ultrasound was found in 38 of 50 patients (76%). It has been reported a prevalence of fatty pancreas at ultrasound examination in about 50% of adults with biopsy-proven Non Alcoholic Steatohepatitis (NASH) [16], while another study in children reported that prevalence of fatty pancreas in approximately half of children with NAFLD, and this percentage was of about 80% in patients with biopsy-proven NASH [17]. Another study showed that about 68% of cases with fatty pancreas concurrently had fatty liver, but most subjects (97%) with fatty liver had fatty pancreas. The positive predictive value of fatty liver in fatty pancreas was around 70%, but the negative predictive value of fatty liver in normal pancreas was high to 96%. These findings suggested that fatty pancreas could be an initial indicator of ectopic fat deposition and an earlier manifestation of metabolic syndrome than fatty liver [18]. It has been reported that approximately 71.7% (38/53) of the subjects with fatty pancreas also had fatty liver disease, while the proportion of subjects with fatty pancreas among individuals with fatty liver disease was merely 10.5% (38/363) [15]. Fatty liver disease was significantly associated with fatty pancreas (p<0.05), confirming previous studies based on ultrasound (US) [19] and magnetic resonance imaging (MRI) (20). Furthermore, findings of EUS studies showed an association of fatty pancreas with hepatic steatosis [10], and findings of one MRI study revealed a correlation of pancreatic fat content with liver fat content [20]. In contrast, no association between pancreatic fat and liver fat was found in other MRI studies [21]. The findings of one autopsy study demonstrated that total pancreatic fat is significantly correlated with NAFLD [22]. In the current study, among the 66 subjects who showed fatty pancreas, 18 patients were found to have mild fatty pancreas (grade I ), 12 moderate fatty pancreas (grade II ), and 36 severe fatty pancreas (grade III ). Sever fatty pancreas was noted in 26 patients (52.0%) with NAFLD (group I) compared to 10 healthy individuals (group II) (20.0%) (p<0.001) demonstrating statistically significant correlation of NAFLD with fatty pancreas severity.
In the current study, the mean age of patients with NAFPD was (44.15 ± 10.24) years which was significantly higher compared to non NAFPD subjects (39.12 ± 11.17). This result agreed with a study which reported that the prevalence of NAFPD is more frequent with increasing age [23]. Fatty replacement on pancreas was an inevitable aging process [24]. Other studies using cut off of 60 yearold age [25] and 35 year-old age [11] also showed an association of NAFPD with age. It has been reported that presence of fatty pancreas was significantly associated with age>35 years [11]. This also came in agreement with a result of study which showed a positive correlation between age and fatty pancreas, with increasing prevalence of fatty pancreas with age [15]. Therefore, older age is considered as an important risk factor of NAFPD. This might be related to lipid metabolism dysfunction being aggravated by age-related slowing of metabolism and aggravation of ectopic fat deposition caused by prolonged dyslipidemia [26].
On the contrary to the previous studies [11], our study showed no association of male gender and NAFPD. It was hypothesized that men are at higher risk to develop NAFPD because they had more visceral (abdominal) fat deposition while women had more subcutaneous (glutealfemoral) lipid deposition [25-27].
Our data showed that as compared to the absence of fatty pancreas, the presence of the disease was associated with higher values of BMI. In the fatty pancreas group to compared non-fatty pancreas group, the mean body mass index (30.4(27.45-35.65) kg/m2 vs. 27.3 (25.88-29.33) kg/m2, P<0.001) was statistically higher [18]. This result came in agreement with the study which showed that the proportions of subjects with central obesity and BMI>24 kg/m2 were significantly higher in the FP group than those in the non-FP group (90.6% vs. 43.9% and 28.3% vs. 11.7%, respectively) [15]. Available studies have also reported an association between BMI and fatty pancreas [9,11,18].
The present study revealed that fatty pancreas and normal pancreas groups did not differ with respect to liver function except for γ-glutamyl transpeptidase (γGT) values. γ-glutamyl transpeptidase (γGT) levels (19(13.75- 24.5) vs. 14(11.25-21.25), P=0.009) showed significant differences between the two groups. In a previous transabdominal ultrasonographic study, it has been reported a correlation between fatty pancreas and liver enzymes including AST, ALT, and γGGT [18]. In contrast, another study showed that no significant associations were found between fatty pancreas and AST, ALT, and γGGT levels [15].
As compared to the normal pancreas group, the fatty pancreas group was characterized by a significantly higher total cholesterol (195.21 ± 51.92 vs. 158.76 ± 44.62, P=0.001), TG (123(93.75-180.25) vs. 71(59-100.5), P< 0.001), LDL-C (119.8(90.05-169.6) vs. 97.5(75.85- 126.5), P<0.001), and VLDL-C values (24.6(18.75-36.05) vs.14.2(12.1-20.1), P<0.001) and by a significantly higher Cholesterol/HDL (5.31(4.11-6.8) vs. 3.8(3.37-5.58), P=0.007) and LDL/HDL ratios (3.86 ± 2.26 vs. 2.9 ± 1.22, P=0.024). By contrast, no differences in HDL-C values between the two groups were observed. Available study has reported that fatty pancreas was associated with higher levels of total cholesterol, triglycerides and high density lipoprotein cholesterol than the control group [18].
In the present study there were statistically significant associations between NAFLD group and components of metabolic syndrome (MetS) including aging, obesity, type 2 Diabetes mellitus (T2DM), and dyslipidemia. In agreement of our results, fatty liver was reported to be associated with insulin resistance, dyslipidemia, and obesity and is therefore considered a phenotype of metabolic syndrome [28]. The present study revealed significant associations of fatty pancreas with aging, obesity, T2DM, and dyslipidemia and association between NAFPD and NAFLD. Finally, Our findings indicated that NAFPD and NAFLD may had the same risk factors leading to fat accumulation in both organs such as obesity, dyslipidemia and diabetes, so that control of these risk factors decreases the incidence of both diseases.
Conclusion
Pancreatic fat should not be considered an inert accumulation of fat. The present study suggests that fatty pancreas could be an initial indicator of ectopic fat deposition and an earlier manifestation of metabolic syndrome than fatty liver. Further study about the long standing condition of fatty pancreas will be needed to detect it’s progression.
Acknowledgments
Thanks to Benha University for funding the project (Fatty liver Among Employees at Benha University) as the thesis is part from it.
References
- Tarantino G, Savastano S, Colao A. Hepatic steatosis, low-grade chronic inflammation and hormone/growth factor/adipokine imbalance. World J Gastroenterol. 2010;16:4773-83.
- Alempijevic T, Dragasevic S, Zec S, et al. Nonalcoholic fatty pancreas disease. Postgrad Med J. 2017;93:226-30.
- Hori M, Takahashi M, Hiraoka N, et al. Association of pancreatic fatty infiltration with pancreatic ductal adenocarcinoma. Clin Transl Gastroenterol. 2014;5:1-5.
- Mathur A, Zyromski NJ, Pitt HA, et al. Pancreatic steatosis promotes dissemination and lethality of pancreatic cancer. J Am Coll Surg. 2009;208:989-96.
- Tomita Y, Azuma K, Nonaka Y, et al. Pancreatic fatty degeneration and fibrosis as predisposing factors for the development of pancreatic ductal adenocarcinoma. Pancre. 2014;43:1032-41.
- Schaefer JH. The normal weight of the pancreas in the adult human being: A biometric study. Anat Rec. 1926;32:119-32.
- Ogilvie RF. The islands of langerhans in 19 cases of obesity. J Pathol Bacteriol. 1933;37:473-81.
- Smits MM, van Geenen EJ. The clinical significance of pancreatic steatosis. Nat Rev Gastroenterol Hepatol. 2011;8:169-77.
- Wang CY, Ou HY, Chen MF, et al. Enigmatic ectopic fat: Prevalence of nonalcoholic fatty pancreas disease and its associated factors in a Chinese population. J Am Heart Assoc. 2014;3:297-04.
- Sepe PS, Ohri A, Sanaka S, et al. Prospective evaluation of fatty pancreas by using EUS. Gastrointest Endosc. 2011;73:987-93.
- Lesmana CR, Pakasi LS, Inggriani S, et al. Prevalence of non-alcoholic fatty pancreas disease (NAFPD) and its risk factors among adult medical check-up patients in a private hospital: A large cross sectional study. BMC Gastroenterol. 2015;15:1-5.
- Ahn JM, Paik YH, Min SY, et al. Relationship between controlled attenuation parameter and hepatic steatosis as assessed by ultrasound in alcoholic or nonalcoholic fatty liver disease. Gut Live. 2016;10: 295-02.
- Lee JS, Kim SH, Jun DW, et al. Clinical implications of fatty pancreas: Correlations between fatty pancreas and metabolic syndrome. World J Gastroenterol. 2009;15:1869-75.
- Marks WM, Filly RA, Callen PW. Ultrasonic evaluation of normal pancreatic echogenicity and its relationship to fat deposition. Radiol. 1980;137:475-9.
- Wang D, Xiao-ping Yu, Wei-ming, et al. Prevalence and clinical characteristics of fatty pancreas in Yangzhou,China: A cross sectional study. Pancreatol. 2018;18:263-68.
- Uygun A, Kadayifci A, Demirci H, et al. The effect of fatty pancreas on serum glucose parameters in patients with nonalcoholic steatohepatitis. Eur J Intern Med. 2015;26:37-41.
- Della Corte C, Mosca A, Majo F, et al. Nonalcoholic fatty pancreas disease and Nonalcoholic fatty liver disease: More than ectopic fat. Clin Endocrinol. 2015;83:656-62.
- Lee JS, Kim SH, Jun DW, et al. Clinical implications of fatty pancreas: Correlations between fatty pancreas and metabolic syndrome. World J Gastroenterol. 2009;15:1869-75.
- Wu WC, Wang CY. Association between non-alcoholic fatty pancreatic disease (NAFPD) and the metabolic syndrome: Case-control retrospective study. Cardio vasc Diabetol. 2013;12:77.
- Sijens PE, Edens MA, Bakker SJ, et al. MRI-determined fat content ofhuman liver, pancreas and kidney. World J Gastroenterol. 2010;16:1993-98.
- Heni M, Machann J, Staiger H, et al. Pancreatic fat is negatively associatedwith insulin secretion in individuals with impaired fasting glucose and/orimpaired glucose tolerance: A nuclear magnetic resonance study. Diabetes Metab Res Rev. 2010;26:200-05.
- van Geenen EJ, Smits MM, Schreuder TC, et al. Nonalcoholic fatty liver disease is related to nonalcoholic fattypancreas disease. Pancre. 2010;39:1185-190.
- Juliyanti Fu , Rinaldi C, Lesmana A, et al. Non-alcoholic fatty pancreas disease and its associated factors in type 2 diabetes mellitus patients. J Pancre. 2017;18:52.
- Tariq H, Nayudu S, Akella S, et al. Non alcoholic fatty Pancreatic disease: A review of literature. Gastroenterol Res. 2016;9:87-91.
- Choi CW, Kim GH, Kang DH, et al. Associated factors for a hyperechogenic pancreas on endoscopic ultrasound. World J Gastroenterol 2010;16:4329-34.
- Wallace TM, Levy JC, Matthews DR. An increase in insulin sensitivity and basal beta-cell function in diabetic subjects treated with pioglitazone in a placebo-controlled randomized study. Diabet Med. 2004;21:568-76.
- Blaak E. Gender differences in fat metabolism. Curr Opin ClinNutr Metab Care. 2001;4:499-02.
- Park BJ, Kim YJ, Kim DH, et al. Visceral adipose tissue area is an independent risk factor for hepatic steatosis. J Gastroenterol Hepatol. 2008;23:900-07.