Review Article - Journal of Environmental Waste Management and Recycling (2021) Volume 4, Issue 1
Hydrodynamic studies of wells as a tool for adjusting geological data and assessing the influence of underlying water on the development of reservoir pk1-3 of the east-messoyakhskoye field
Kovalenko Igor Victorovich*
Gazpromneft Science and Technology Center, Tyumen city, Russia
- Corresponding Author:
- Kovalenko IV
Gazpromneft Science and Technology Center
Tyumen City
Russia
E-mail: Kovalenko.IV@gazpromneft-ntc.ru
Accepted date: December 12, 2020
Citation: Victorovich KI. Hydrodynamic studies of wells as a tool for adjusting geological data and assessing the influence of underlying water on the development of reservoir pk1-3 of the east-messoyakhskoye field. Environ Waste Management Recycling. 2021;4(1):1-4.
Abstract
The paper presents the experience of well test results for geological and simulation models correction at the stages of experimental industrial exploitation and industrial exploitation of the heavy oilfield with a system with horizontal wells. The potential for each borehole can be influenced by the geological structure of the reservoir (Boundaries, Facies, Water-Oil Contact, Gas-Oil Contact, etc.) and the perfection of technological completion (contamination of the bottom zone, lack of inflows from the horizontal segment, etc.). An instrument to clarify the structure of the reservoir and the perfecting of the autopsy is the conduct of the well test. As a result of the studies carried out, the PK1-3 reservoirs were characterized by characteristics contrary to the standard approaches of the well test in horizontal wells [1]. The theoretical reasons for these features are discussed in the paper. The most important issue for decision-making on the further development of the deposit is the introduction of a reservoir-pressure system. The question of the need to introduce the injection wells or to work in elastic mode? In the case of pumping, drilling to the target well reservoir or to the water of the saturated power? At the initial stage of development, these issues are one of the main concerns in connection with the active drilling of the field and significant selection of the mining fund. Thus, the process of reducing pressure on the reservoir may lead to irreversible phase transitions associated with the allocation of gas. This article discusses a comprehensive assessment of the well test structure of the reservoir, an approach to estimating the aquifer. In the joint work of the wells, there is a parallel influence between the boreholes and the interference of the pressure through the well. In relation to the relationship and response value, the "total" capacity was calculated and the areas with the greatest influence of the aquifer were identified, and the geological relationship of the neighboring Wells was refined. Similarly, the rate of pressure drop in the work of the aquifers has been calculated and conclusions reached. A conceptual strategy has been developed for reservoirs of similar abundance in order to reduce prematurely the risks of reduced reservoir pressure.
Keywords
High-Viscosity Oil, Unconsolidated Sandstones, Field Development Control, Oil Recovery Coefficient, Horizontal Wells, Diagnostics and Development Management, Well Test Analysis, Aquifer.
Introduction
The choice of the optimal development system for objects with complex geology depends on many factors, the knowledge of which helps to make correct decisions, which further affects the rate of oil production throughout the development of the object, as well as the coefficient of oil recovery. For the object of development PK1-3 of Vostochno-Messoyakhskoe field relevant factors understood the magnitude of the influence of bottom waters and the lateral connections of the object.
For the entire thickness of the formation PK1-3 is characterized by the absence of regionally sustained clay layers, as a result of which the deposits are in many areas a single geological and hydrodynamic system belonging to the lithogenetic types of coastal and marine faeces [1]. The deposit is gas-oil, massive, complicated by tectonic disturbances, lies in a complex interlayer of highly porous sandstones, siltstones and mudstones of the pokur formation. The classic approach to developing this kind of oil reserves is to drill long horizontal wells. At the same time, as a rule, the development of oil rims is complicated by gas and water breakouts. Another important issue for decision-making on the development of the field is the need to implement a system of water injection and the duration of the well development period before injection. In these conditions, obtaining information about the work of the formation, control and management of development is extremely relevant and at the same time a difficult task [2].
The paper considers the applicability of the results of well testing on horizontal wells to identify and differentiate the geological features of the PK1-3 formation associated with the aquifer at various regions in the development of the Vostochno-Messoyakhskoye field. The obtained results helped not only to update the current geological and simulation model [1], but also influenced the decision-making on the choice of the optimal development system, the timing of the implementation of the water injection system.
Well testing as a tool to clarify the geological features of the formation
The integration of data from various methods of well testing helps to collectively provide an answer to the presence or absence of the influence of plantar water on filtration to the horizontal wellbore.
The target layer PK1-3 is divided into three zones A, B, C (Figure 1):
A - Poorly studied, predominantly gas-saturated zone
B - Floodplain part, sub-gas zone
C - Channel part, the primary object of development, highly permeable oil-saturated layer, located near the oil-water contact

Figure 1: Geological structure of the PK1-3 formation.
It is assumed that zone "C" has connection with oil-water contact, zone "B" is mainly isolated by a clay bridge from zone "C".
Problems according to well testing and well performance:
• Almost all horizontal wells drilled do not have linear flows on diagnostic plots. After 10 hours of shutting, the pressure derivative enters the shelf of the radial flow transient regime, which lasts up to 1000 hours. From the point of view of the classical approach to well test, this suggests that the main part of the well is not involved in the work. To combine data on various methods of testing on a number of wells were conducted field-geophysical studies, which in turn showed the work of a significant part of the horizontal wells
• Number of wells received water inflow associated with cone formation from the lower water-saturated layers. This is quite well diagnosed both by the mode of operation and by the well testing. The water cut sharply increases to 99%, and on the diagnostic graph there is a drop in the pressure derivative-the formation of a spherical flow regime [1]
• Numbers of wells were diagnosed with the negative impact of gas. On pressure build-up mode the wells are restored periodically to initial pressure and to abnormally high. The main version is considered to be the effect of the high suspension of the pressure gauge. The pressure gauge after shutting the well at the build-up is either in the liquid phase or in the gaseous phase [3]. The gas released after degassing compresses the oil under the gauge and distorts the data at the initial times
During the shutdown of one of the wells at the build-up, a new drilled neighbouring well, located 150 meters away, was launched into operation. The launch response was obtained within a short time interval (Figure 2). The rate of reaction is affected by the value of piezoconductivity of the reservoir (equation 1), the amplitude of the generated pulse affects the value of hydraulic conductivity (equation 2). Thus, knowing the reaction time and the magnitude of the amplitude, it is possible to obtain the permeability value from the piezoconductivity equation (equation 3), and from the hydro conductivity-the value of the effective reservoir thickness (equation 4) [2].

Figure 2: Well interference testing wells 601G, 1601G.
According to signals obtained on these wells and the previous equations reservoir thickness was calculated, which ranged from 100 meters to 120 meters, which is much higher than oil-thickness of the reservoir in geological model [4]. These thickness results were superimposed on the map of the clay barrier of zone C and aquifer, which allowed us to conclude: where the clay barrier is smaller-the thickness of the interference test increases (Figure 3).

Figure 3: Reservoir thickness according to well interference testing.
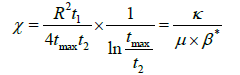 (1)
(1)
where χ -piezoconductivity, m2/sec; R-the distance between the disturbing and reacting wells, t1-the time between the first and second changes in the flow rate of the disturbing wells, sec; t2-time delay signal (tmax- t1), tmax-the time since the first change in the flow rate, κ -permeability of the formation, μ -viscosity of the liquid in formation conditions [5], MPa × sec; β* : coefficient of elastic capacity of the formation, 1 kg/cm2.
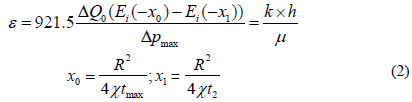
Where ε -the coefficient of hydraulic conductivity of the formation, (mm2 × m)/(MPa × sec); Ei ( x) − -integral exponential function of the argument x; Δpmax -the maximum pressure change in the reacting well, PA, h-the effective power of the formation, m.
κ = χ ×μ ×β * (3)
 (4)
(4)
After unambiguous determination of the influence of the underlying water, we returned to the question of the absence of a continuous regime of linear transient flow in the testing of horizontal wells. The option of shutting down the well at the build-up during the operation of not only the oil-saturated reservoir, but also the water-saturated part is calculated (Figure 4). In this case, the response created from the impenetrable border is diagnosed at a fairly late time, or not diagnosed at all [6]. As a result, the error occurs not only in determining the effective length of the horizontal well, but also in determining the permeability.

Figure 4: Model curves of well testing of horizontal well (1000 meters) at effective reservoir capacity of 20 m (yellow and green) and 120 m (red and brown).
However, quite long linear flows were obtained for a number of wells. These wells were divided by geological location into zone B and C. The linear transient flow in the wells of zone B is a consequence of the horizontal well, since the zone itself is not hydro dynamically associated with the aquifer and the pressure response to the roof and sole is diagnosed by a linear flow on the pressure derivative [7].
Also, the analysis of geological and hydrodynamic connectivity of launched wells was performed, which showed in more than half of the cases the lack of connection. The map based on the results of the analysis helped to clarify the geological features of the formation in the production zone [8].
The influence of the underlying water at the rate of decline of reservoir pressure
On a sector model calculation on a grid of wells with typical placement for a zone C-150 meters between wells is carried out. The growth of mobility with depth-in water is 30 times more (Figure 5). The calculation shows that when working 120 meters and average production rate is 50 m3/day, the rate of decline in reservoir pressure at the region is 29 atm per year [9], which means the need to enter the water injection wells in the first year of operation of the wells.

Figure 5: The presence of hydrodynamic connection between launched wells on the coherence map.
Diagnostic graph of build-up according to the data on the sector model (Figure 6) identical with analytical calculations and has similarity with actual data.

Figure 6: Sector model of a typical development region with a reservoir thickness of 120 meters.

Figure 7: Diagnostic graph of actual and model build-up; ?): Model curve Heff=120 m; b): The actual curve.
In addition to the powerful aquifer underlay layers; there is lateral support from the aquifer according well surveys, which means operation without the introduction of water injection wells for a period of about one year. Long-term monitoring of wells on the simulation model confirmed the participation in the filtration of additional downstream aquifer capacity of 150 meters-200 meters and the influence of the horizontal aquifer in the amount of 20% compensation of liquid production [10].
Conclusion
• Due to the understanding of the rate of pressure drop at the Vostochno-Messoyakhskoye field, the time of well development before transfer to the water injection was increased from 6 months to 12 months
• According to the results of the well testing it was recommended to convert to water injection wells with the highest water cut to compensate the pressure loss through the underlying water layers
• In the wells of zone B injection of fluid at low repression is necessary to ensure lateral flooding and minimize the water breaks
• Conceptual scheme was made for horizontal wells testing for determining the geological features of the formation structure and making decision of water injection beginning
References
- http://oilindustry.net/en/Journal/archive_detail.php?ID=11413&art=232229
- Erlager R. Hydrodynamic methods for well testing. M. The Institute of Computer study. 2006.
- Sarancha AV. Results processing of hydrodynamic studies of wells of the Bazhenovskaya suite. Environ Earth Sci. 2019;378(1):012099.
- Ponomareva IN, Martyushev DA, Akhmetova MI. Evaluation of the optimal duration of the hydrodynamic studies of low-productivity wells on the example of Ozernoye field (Russian). Oil Ind J. 2016;1:55-9.
- Alinejad K, Dabbagh R, haghkish N. An investigation on effective factors on total productivity of water and wastewater industry using multicriteria decision-making approach (MCDM) (water and Wastewater Company of West Azerbaijan in Iran). J Environ Waste Manage Recycl. 2018;1(2):21-8.
- Bo?ovi? ?, Polom?i? D, Baji? D, et al. Hydrodynamic analysis of radial collector well ageing at Belgrade well field. J Hydrol. 2020;582(4):124463.
- Levasseur A, Shi L, Wells NC, et al. A three-dimensional hydrodynamic model of estuarine circulation with an application to Southampton Water, UK. Estuar Coast Shelf Sci. 2007;73(4):753-67.
- Putilov I, Krivoshchekov S, Vyatkin K, et al. Methods of predicting the effectiveness of hydrochloric acid treatment using hydrodynamic simulation. Appl Sci. 2020;10(14):4828.
- Lamarre RA. Hydrodynamic and stratigraphic controls for a large coalbed methane accumulation in Ferron coals of east-central Utah. Int J Coal Geol. 2003;56(1):97-110
- Abdelhady A. Radiological risks associated with transportation of liquid waste generated from 99Mo production. Environ Waste Manage Recycl. 2017;1(1):1-4