Research Paper - International Journal of Pure and Applied Zoology (2018) Volume 6, Issue 3
GASTRO-SOMATIC AND FEEDING INDICES OF FRESHWATER CRABBARYTElPHUSA lUGUBRIS FROM KATHMANDU, NEPAL
Saroj Rana*
Amrit Science Campus Lainchaur, Tribhuvan University, Kathmandu, Nepal
- *Corresponding Author:
- Saroj Rana
Amrit Science Campus Lainchaur, Tribhuvan University, Kathmandu, Nepal
E-mail: sarojranabista@gmail.com
Received 2nd August 2018; Accepted 7th September 2018; Published 17th September 2018
Abstract
Gastro-somatic, feeding and vacuity indices of fresh water crab Barytelphusa lugubris were determined by collecting 692 crabs from Sangla Kunchi Pwakal, Village Development Committee, Kathmandu, Nepal from April 2007 to April 2008. The collected crabs were killed with chloroform and weighed. Crabs were dissected and complete alimentary canal was weighed. Then finally, only the contents from the stomach was removed, weighed and recorded. The seasonal and monthly gastrosomatic (GSI), feeding (FI) and vacuity indices were analyzed. The result indicated that the minimum and maximum (GSI) was (2.29) in summer (September) and (3.70) in spring (April 08) with significant fluctuations (p-value = 3.36e-12<0.05) for 13 months. Similarly, minimum and maximum FI recorded was (4.52) in autumn (November) and maximum (24.85) in spring (July) respectively. Similarly minimum and maximum vacuity index (VI) was (11.11) in spring (April, 2008) and (89.29) in autumn, (November).The mean coefficient of variance for gastro-somatic and feeding indices were 29.06% and 86.89% respectively. This indicates mores table GSI compared to F.
Keywords
Barytelphusa lugubris; Brachyuran crab Gastro-somatic; Vacuity; Indices
Introduction
Knowledge on the food, feeding habits and trophic interrelationships is essential to understand the growth, breeding and life history of crabs including migration (Bal and Rao, 1984). This also helps to know the predicted changes on ecosystem due to natural or anthropogenic interventions. Food and feeding affects the density, growth, reproduction and survival of a natural population in any aquatic ecosystem. Knowledge of food in an organism is generally very important for studies of its nutritional requirements, its interactions with other organisms and potential for culture. Feeding activity affects the growth and productivity of an aquaculturable species, Mahaseth, (2007). Razak, et al., (2017) studied feeding ecology and food preferences of Cherok Paloh Pahang horseshoe crab Tachypleus gigas and also investigated gastrosomatic and feeding indices of the same species. Pramanik and Mohanty, (2016) studied length-weight relationship and biology of some common edible fish species at Chandipur, Bay of Bengal, Odisha and also reported seasonal feeding habit and seasonal feeding intensity of six different species of fishes. Kumar, (2015) reported food and feeding habits of Johnius carutta (Bloch, 1793) off Visakhapatnam, East-coast of India. Sourinejad, et al., (2015) observed feeding habits of yellowfin seabream, Acanthopagrus latus in the northern region of the Persian Gulf. Saker, et al., (2013) studied food and feeding habits of Priacanthus hamrur from Mumbai in which they also reported seasonal feeding habit dealing gastrosomatic index. Poojary, et al., (2010) described food and feeding habits of the Indian scad, Decapterus russelli (Ruppell, 1830) from Mumbai waters, north-west coast of India. Alavi and Kalbasi, (2006) reported composition of diet of Caspian sand Goby, Neogobius fluviatilis pallasi, from south of Caspian Sea. Chatterji, et al. (1992) studied feeding behavior and feeding intensity of horse-shoe crab Tachypleus gigas. The gastro-somatic index (GSI) of any naturally occurring population describes seasonal feeding habit of that population and could be studied by analyzing the gastro-somatic or viscera somatic index. The gastro-somatic index or viscera-somatic index could be calculated from the weight of the gut or the weight of the viscera as percentage of total body weight (Mahaseth, 2007). The commercially important portunid crabs found along Parangipettai coast are Scylla serrata, S. tranquebarica, Portunus sanguinolentus, P. pelagicus, Podophthalamus vigil, Charbdisferiata, C. lucifera, C. natator, C. granulata and C. truncata (John Samuel et al., 2004). Although, GSI of very few of the crab species have been reported, food and feeding habits of brachyuran crabs have been by studied using gut content analysis almost in all marine and marketable species, such as Portunus pelagicus, Scylla serrata and Chinese mitten crab (Eriocheir sinensis) Hemigrapsus spp. Cancer spp. Lophopanopeus bellus bellus, and Pugettia producta (Woll, et al., 2006; Rudnik and Resh, 2005; Josileen, 2001; Prasad and Neelakantan, 1988; Hill, 1976 and Knudsen, 1964). It helps to find out the seasonal variation in the feeding intensity of the naturally occurring organisms. Generally Gastro somatic index varies with the season, maturity and it is maximal during the post spawning period and minimum during the breeding period (Sattar and Adam, 2005). Similarly, the feeding index describes the seasonal variations in the feeding intensity or capacity in different of a naturally occurring population. The feeding intensity of the mature crab decreases during breeding season as a major portion of the abdominal cavity becomes occupied by the compactly arranged ova in the gonads, which exerts the pressure on the stomach (Raman and Srinivasagam, 1978). It could simply be considered as the degree of feeding during different months or the seasons and is in influenced by different environmental as well as biological factors like season, climatic condition, age maturation, availability of food, spawning etc (Desai, 1970). The study of feeding helps to identify the occurrence of food items, but it is not likely to assess the diet preferences of crabs without detailed harmonizing studies to estimate the range and abundance of possible food items available in their natural environment (Biswas, 1993). It is clear that food habits such as frequency of feeding or size and species of prey, are constrained by the evolutionary history leading to the species body shape and digestive system, (El-Greisy, 2005).
Materials And Methods
Study Site
The study area is a terraced bog paddy field carrying only 30 m in length and 12 m in width, at Singla Kunchi Pwakal Village Development Committee (V. D. C.) situated between 27°47’ North latitude and 85°22’ East longitudes from Budhanilkantha and 27°45’ north latitude and 85°15’ East longitudes from Nagarjun, on the extreme Northwestern hill of Katmandu. Sangla is the mid hill mountain tract, located at the bank of Baundeshwar stream. Sangla. It is bounded by Jhor, Mahankal V. D. C. on the east; on its southeastern border is Chandeshwari. Pulung is to its South and Nuwakot is on the northern border and western region demarcated by Kabhresthali (Figure 1A). Baundeshwar is a perennial hill stream originating from a high mountain. Water from the stream is canalized for drinking purpose, leaving little of it for the use of local people. Large and small boulders with rotten woods providing the hideouts for crabs, occupy their habitat. Bushes and a few small trees on sides, grasses, weeds and reeds in the field surround it. It is situated on the north- western region of the hill where the sun sets early during both summer and winter and the location is comparatively colder. Baundeshwar stream being deep from the paddy fields, all water from the study area drains into the river. Even then there is always a direct impact of river water on the paddy fields and the vice-versa, as water from the stream is used for irrigation in the fields and seeping water from the fields drains into the river (Figures 1B and 1C). The stream is 4 m to 3 m deep from the paddy field. The width of the stream ranges from 1.5 m to 3 m., but water depths in the stream vary with seasons. During rainy season water depth ranges from 40 to 15 cm. It remains 7 to 5 cm and 3 to 1 cm during autumn and winter respectively.

Figure 1: Study area (A), Hole of crab (B), Crab's habitat (C).
Methods
A total of 692 crabs were hand-picked alive from Sangla Kunchi Pwakal, Village Development Committee, Kathmandu, Nepal from April 2007 to April 2008 with a minimum of 50 per month. The collected crabs were killed with chloroform for instant killing to prevent further mastication and digestion of food present in the stomach, and weighed individually. Crabs were dissected and whole alimentary canal was weighed. Finally, the stomach content from each alimentary canal was removed and weight. The seasonal feeding condition and feeding intensity of a naturally occurring population of crabs were assessed by calculating gastro-somatic (GSI) and feeding indices as described by Mahaseth, (2008).
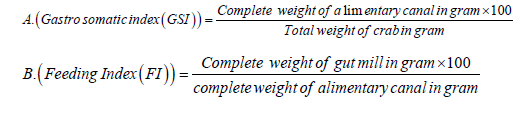
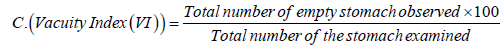
Vacuity Index or the stomach emptiness index determines the amount of the fish appetite (crab's appetite) for food and was calculated using the following equation (Euzen, 1987)
Results
Amongst total (n=692) number of crabs dissected, 194 were with empty stomach and constituted 28% of the total population. The feeding habits of crabs remained nearly constant throughout the study period. The average value of gastro-somatic index (GSI) ranged from 2.29 to 3.70. Significant fluctuations (t=27.457, df=12, p=3.36e-12<0.05) observed in GSI for 13 months (Figure 2). The minimum (2.29) GSI was observed in summer (i.e. in the month of September) whereas maximum (3.70) was recorded in spring (i.e. in the month of April 08). Similarly, the mean feeding index of B. lugubris ranged from 5.72-24.85 with significant fluctuations in FI was observed during the study period (t=8.1521, df =12, p-value=3.099e-06<0.05). The minimum FI recorded was (7.13) in summer (i.e. in the month of September 07), whereas maximum FI observed was (24.85) in spring (i.e. in the month of April 08). Positive correlation (r= 0.12, P -value = 0.71>0.05) was found between feeding index (FI) and gastro-somatic index (GSI) (Figure 3). The mean coefficient of variance for gastro-somatic index and feeding index was 29.06% and 86.89% respectively. Thus indicated more consistent or stable GSI throughout the 13 months when compared to FI. The vacuity index (VI) was minimum (11.11) in spring (i.e. in the month of April 08) and maximum (89.29) in autumn (i.e. in the month of November). Significant difference (t=9.1313, df=12, p-value=9.473e-07<0.05) was observed in vacuity index (VI). The negative correlation (r=-0.25, p=0.42>0.05) was found between the gastro-somatic index (GSI) and vacuity Index (VI). The result indicated that when empty stomachs increased full stomachs will be decreased. In other word, greater the GSI lesser will be the VI and are inversely proportional with each other (Table 1).
| Seasons | Months | Average Wt. of Ali (gm) | Average Wt. of GM (gm) |
TW (gm) | GSI | FI | FS | ES | VI |
| Spring | Apr. 07 | 0.73 | 0.17 | 22.19 | 3.29 | 23.15 | 25 | 8 | 32.00 |
| May | 0.73 | 0.11 | 27.24 | 2.67 | 14.84 | 25 | 9 | 36.00 | |
| Jun | 0.99 | 0.25 | 37.60 | 2.63 | 24.85 | 26 | 7 | 26.92 | |
| Summer | July | 0.66 | 0.10 | 19.72 | 3.35 | 15.76 | 34 | 14 | 41.18 |
| Aug. | 0.66 | 0.06 | 27.19 | 2.43 | 9.09 | 25 | 13 | 52.00 | |
| Sept. | 0.53 | 0.04 | 23.24 | 2.29 | 7.13 | 25 | 18 | 72.00 | |
| Autumn | Oct. | 0.48 | 0.08 | 17.48 | 2.76 | 15.73 | 25 | 18 | 72.00 |
| Nov. | 0.60 | 0.05 | 19.99 | 3.00 | 7.61 | 28 | 25 | 89.29 | |
| Dec. | 0.59 | 0.07 | 16.67 | 3.53 | 11.04 | 28 | 22 | 78.57 | |
| Winter | Jan. | 0.48 | 0.03 | 17.50 | 2.74 | 6.67 | 29 | 24 | 82.76 |
| Feb. | 0.40 | 0.02 | 13.57 | 2.96 | 5.72 | 25 | 22 | 88.00 | |
| Mar. | 0.50 | 0.04 | 14.70 | 3.39 | 8.23 | 30 | 11 | 36.67 | |
| Spring | Apr. 08 | 0.77 | 0.14 | 20.81 | 3.70 | 17.53 | 27 | 3 | 11.11 |
| Wt: Weight; Ali: Alimentary Canal; GM: Gut Mill; TW: Total Weight; GSI: Gastro-Somatic Index; FI: Feeding Index; VI: Vacuity Index; FS: Full Stomach; ES: Empty Stomach. | |||||||||
Table 1: Gastro-somatic index, Feeding index and Vacuity index of B. lugubris.

Figure 2: GSI vs. VI of 13 months.

Figure 3: FI vs. VI of 13 months.
Discussion
Understanding crab's nutrition habit requires wide field and laboratory studies to inter the central sources of nutrition for a species. The seasonal feeding habit and seasonal feeding intensity and seasonal appetite of fresh water crab, Barytelphusa lugubris were assessed. The result of mean coefficient of variance for gastro-somatic index (seasonal feeding habit) and feeding index (seasonal feeding intensity) was 29.06% and 86.89% indicating more consistent or stable GSI throughout the 13 months when compared to FI. The maximum (24.85) FI was observed during June after spawning; as these crabs carry eggs and juveniles in their brood pouch and being wetland/ bog dweller have to plunge frequently in water to rehydrate the developing embryos, thus their feeding index was more during the month of June. However, Cancer oregonensis and Neptunus pelagicus do not eat while carrying eggs in pleopods (Knudsen, 1964; Prasad and Tampi, 1951) as they inhabit in sea and release their larvae in water might need less energy or due to stress.
The feeding intensity decreased with the commencement of winter without rain (Henmi and Koga, 2009), revealed that during winter the crab mostly hibernate due to cold, while feeding is high after rain similarly, the crab feeds more and digests more while the temperature is high in summer with more food and green materials, thus substantiate with present findings. Gastro somatic index analysis showed that the feeding intensity of the crab Carcinoscorpius rotundicauda was higher during non-monsoon period (Pahang, et al., 2012) concede with present findings as maximum (3.70) GSI was found in spring season. Behzadi, et al. (2018) recorded the lowest GSI values for both male (3.1) and female (2.9) Rachycentron canadum in the summer thus admit present findings with minimum, GSI in summer, but the highest values of VI (4.9 and 4.3) were observed for males and females in the winter, do not agree with present results being different species (fish and crab), their feeding habits and habitat of occurrences, topographical and geographical variations. Norouzi, et al. (2012) reported significant annual fluctuation in GSI of Lizardfish (Saurid tumbil) concede with present finding with annual fluctuations in Barytelphusa lugubris, but high VI (61.11) was observed in summer for Lizard fish differed from present study as high VI in Barytelphusa lugubris was 89.29 in Autumn being completely different species and from different habitats. Baeta, et al. (2006) observed high vacuity levels during moulting period green crabs (Carcinus maenas) and ovigerous females 45% and 43% respectively. Barytelphusa lugubris also do not feed during moulting highest vacuity indices were found in November 07 and February 08 being moulting period (personal observation) and in winter (low availability of food). Bandepei, et al. (2009) found GSI ranged from 3.5% to 8.1% in Cyprinid fish Rutilus frisii kutum from Iranian waters of the Caspian, whereas it ranged from 2.29-3.70 in present findings because of the studied species (fish and crab), feeding habit and habitat of occurrence. Sourinejad, et al. (2015) recoded highest value of GSI of yellow fin sea bream (Acanthopagrus latus) in September (5.22 ± 0.04) and the lowest in December (1.61 ± 0.03) with annual average of 2.50 ± 0.60 differed from present study as maximum (3.70) GSI was observed in April and lowest (2.29) in September. The difference in the GSI might be due to the availability of the food, feeding habits, habitat of occurrence and differences in metabolic activities of the species. Sharifian and Kamarani (2017) observed minimum and maximum VI in June and October (for both male and female) Sodhiana iranica, which differ from the present study as minimum and maximum VI recorded were (11.11) in April 08 and (89.29) in November, whereas GSI, started increasing from December till April in Sodhiana iranica, which substantiate with the present findings as GSI started increasing from the month of January 08 till April 08 in Barytelphusa lugubris. Alavi and Kalbasi (2006) found higher GSI in April, May and June than other months in Caspian sand Goby (Neogobius fluviatilis pallasi) in the south Caspian sea with maximum vacuity index (39.58) which differed from present finding as higher GSI were found in December 07, March 08 and April, 08 with maximum VI (88.00) during February. Barytelphusa lugubris is a small sized crab, inhabitant of a semi terrestrial bog paddy field, which somehow differed because of the differences in the studied species as fish, marine habitat and seasonal variations. Rao and Rao (2002) recorded minimum (0.87) in May and maximum (2.48) GSI in November from Fish, Glossogobius giuris in Gosthani estuary, India, Similarly, Achakzai et al., (2015) found mean value of gastro-somatic index (GSI) was maximum 3.2 in October 2012, while minimum in July 2013 due to spawning, but in present study minimum (2.29) in September and the maximum (3.70) GSI was during April. Similarly, Achakzai et al., (2015) found maximum fullness in March to July and highest emptiness was observed in September which differed from the present finding as minimum (n=3) empty stomach were found in April, 08 and maximum (n=25) empty stomach in November, 2007. Rajani et al (2018) recorded the gastro-somatic and stomach fullness indices of fish, Stolephorus indicus almost uniform with the food item preferred throughout the three seasons.
Pramanik and Mohanty (2016) recorded the seasonal variations in the GSI in six fish species. The ranges of variation were 3.677% in Hilsa ilisha during monsoon to 13.706% in Lizaparsia during monsoon; GSI% in Mugil cephalus was observed to be 5.904 in summer, 4.957 in winter 6.600 in monsoon and 6.526 in post monsoon. The GSI was higher in fishes like Polydactylus paradiseus, Lizaparsia and Johnius carutta were during pre-spawning season, might have consumed more food to be prepared for breeding which needs more energy corroborate the present findings as the highest GSI was observed in spring April 08 was a pre-spawning period of the studied species. But, Raman and Srinivasagam, (1978) revealed that the feeding intensity of mature crab Podophthalmus vigil (Fabricius) decreased during breeding season as the gonads were compactly arranged with the ova occupying a major portion of the abdominal cavity, which exerted pressure on the stomach. Similarly, Sajeevan and Kurup (2013) found that the cobia fed well during post monsoon periods but poor feeding activity was noticed in July. The velocity of the river becomes high during July due to which fishes become unable to catch their food quickly thus, showed low feeding activity. Sadeghi et al. (2018) found vacuity index for ovigerous Portunus segnis crabs was 47.2 and for non-ovigerous females 15.7. Although there was no differentiation in ovigerous and non ovigerous females in present findings, the GSI of B. lugubris was high during reproductive period as this species inhabits in bog or marshy land where there may be lack of water and they have to plunge very frequently in water to rehydrate the developing embryos, thus needs more energy, but, Portunus segnitos is a marine species which is always surrounded by water. Sahoo et al. (2011) found highest feeding index (80.95%) in February, whereas lowest was (60.9%) in June in crab Portunus pelagicus from Chilika Lagoon, Orissa, India differed from present finding as lowest FI (5.72) was in February and highest (24.84) was during April. Different feeding intensity in present findings revealed that the habitat of B. lugubris was not rich enough being bog paddy field as compared to marine Lagoon filled with variety of food for P. pelagicus. But, Das (2008) recorded maximum (5.561) GSI of male S. serrata during January and minimum (1.084) during May but female showed maximum value (5.621) during February and minimum (0.642) value during May. Similarly, Satapathy and Mishra (2007) found maximum GSI of crab Scylla serrata in the month of December and February and minimum in the month of May-June in Chilka Lake. But without differentiation of sexes in B. lugubris the minimum and maximum values of GSI were (2.29 and 3.70) in September and April respectively. In the same species but different sexes showed variation in GSI, that means variation in species also definitely make differences in GSI of the present studied species, due to different habitat, size, and topography. Even Bandpie, et al., (2009) revealed that the feeding activities differ with the season, month, habitat and size of the individuals. But, Kazemiyan (2005) found maximum GSI in spring than autumn in two species of crab Eriphia sebana and Ocypode saratan in the intertidal zone of Chabahar area concede with present findings as maximum GSI was recorded in summer and autumn (3.70 and 3.50) respectively. In most of the cases seasonal feeding habit and feeding intensity differed because it depends on the species, availability of food, habitat, breeding period, topography, geographical region and size of the crabs as well. It is influenced not only by the maturation of gonads but also due to non-availability of food in the habitat (Sahoo, 2011).
As compared to fish very little work has been done in seasonal food, feeding habit and feeding intensity of crabs. Further study on feeding ecology is needed in order to improve the knowledge and importance of crab in the food web of the aquatic ecosystem.
Acknowledgemnets
I would like to thank to my sister Neesha Rana for the help she has provided to me during publication and to Professor Dr. Ramesh Shrestha (Ph.D.) for his valuable suggestions and information to publish and submit article. Thanks are due to Mr. Jay Raj Binadi for his help during manuscript preparation.
References
- Achakzai, W. M., Saddozai, S., and Baloch, W. A. 2015. Food and Feeding Habits of Glossogobius giuris (Hamilton and Buchannan, 1822) Collected from Manchar Lake distt. Jamshoro, Sindh, Pakistan. Glob. Vet. 14: 613-618.
- Alavi, Y.M. and Kalbasi, M. (2006). Study on diet composition of Caspian sand Goby, Neogobius fluviatilis pallasi, in south of Caspian Sea. Iran. J. Biol. 19: 180-190.
- Baeta, A., Cabral, H.N., Marques, J.C. and Pardal, M.A. 2006. Feeding ecology of the green crab, Carcinus maenas (Linneaus, 1758) in a temperate estuary, Portugal. Crustaceana. 79: 1181-1193.
- Bal, D.V. and Rao, K.V. 1984. Marine fisheries. Tata McGraw-Hill Publishing Company, New Delhi, 470. Bandpei, A., Mashhor, M., Abdolmalaki, S. and El-Sayed, M.A. (2009). Food and feeding habits of the Caspian kutum, Rutilus frisii kutum (Cyprinidae) in Iranian waters of the Caspian Sea. Cybium. 33: 193-198.
- Behzadi, S., Kamrani, E., Kaymaram, F. and Ranjbar, M.S. 2018. Trophic level, food preference and feeding ecology of Rachycentron canadum (Linnaeus, 1766), in Hormuzgan Province waters (northern Persian Gulf and Oman Sea). Iran. J. Fish. Sci. 17: 179-193.
- Biswas, S.P. 1993. Manual of methods in fish biology, New Delhi, South Asian Publishers Pvt. Ltd.
- Chatterji, A., Mishra, J.K. and Parulekar, A.H. 1992. Feeding behavior and food selection in the horseshoe crab, Tachypleus gigas. Hydrobiologia. 246: 41-48.
- Das, D. S. 2008. Dynamics of bioindices and feeding in mud Crab Scylla serrat(Forskal) in Sunderban area (Doctoral dissertation). Department of Fishery Biology and Resources Management Faculty of Fishery Sciences, West Bengal University of Animal and Fishery Sciences, Chakgaria, Kolkata.
- Desai, V. R. 1970. Studies on the fishery and Biology of Tor tor (Ham.) from river Narmada. Inland. Fish. Soc. India. 2: 101-112.
- El-greisy, Z. 2005. Reproduction biology and histology of female brushtooth Lizardfish Saurida undosquamis (Richardson), Family: Synodontidae, from the Mediteranean coast of Egypt. Egypt. J. Aquat. Res. 3: 145-149.
- Euzen, O. 1987. Food habits and diet composition of some fish of Kuwait. Kuwai. B. Mar. Sci. 9: 65-85.
- Hill, B. J. 1976. Natural food, foregut clearance-rate and activity of the crab Scylla serrata. Mar. Biol. 34: 109-116.
- John Samuel, N.N. Thirunavukkarasu, P. Soundarapandian, A. Shanmugam and T. Kannupandi, 2004. Fishery potential of commercially important portunid crabs along Parangipettai coast. Proceedings of International conference and exposition on marine living resources of India for food and medicine, Aquaculture Foundation of India, Chennai, 165-173.
- Josileen, J. 2011. Food and feeding of the blue swimmer crab, Portunus pelagicus (Linnaeus, 1758) (Decapoda, Brachyura) along the coast of Mandapam, Tamil Nadu, India. Crustaceana.
- Knudsen, J. W. 1964. Observations of the reproductive cycles and ecology of the common Brachyura and crab like Anomura of Puget Sound, Washington. Pac. Sci. 18: 3-33.
- Kazemiyan, M. 2005. Investigation on reproduction process in two species of crab Eriphia sebana and Ocypode saratan in the intertidal zone of Chabahar area (Doctoral dissertation, Islamic Azad University, Science and Research Branch, Tehran).
- Kumar, S. 2015. Food and feeding habits of Johnius carutta (Bloch, 1793) off Visakhapatnam, East-coast of India. Fish. Technol. 52: 88-94.
- Mahaseth, V. K. 2007. Limnological study of river Mahakali with special reference to Tor species. PhD. Thesis, submitted to department of Zool. Th. DSB Campus, Kumaun University.
- Norouzi, H., Valinssab, T., Kamali, A., Kaymaram, F. and Shamsaei, M. 2012. Evaluation of some feeding index of Saurida tumbil in the northern Persian Gulf and Oman Sea. Ecol. Envir. Conserv. 18: 53-55.
- Pahang, K.T.P.N., John, B.A., Kamaruzzaman, B., Jalak, K. and Zaleha, K. 2012. Feeding ecology and food preferences of Carcinoscorpius rotundicauda collected from the Pahang nesting grounds. Sains. Malays. 41: 855-861.
- Poojary, N., Tiwari, L. R., and Jaiswar, A. K. 2010. Food and feeding habits of the Indian scad, Decapterus russelli (Ruppell, 1830) from Mumbai waters, north-west coast of India. Indian. J. Fish. 57: 93-98.
- Pramanik, D.S. and Mohanty, S.S. 2016. Length-weight relationship and biology of some common edible fish species at Chandipur, Bay of Bengal, Odisha. Int. J. Fish. Aquat. Stud. 4: 335-340.
- Prasad, P. N., and Neelakantan, B. 1988. Food and feeding of the mud crab Scylla serrata Forskal (Decapoda: Portunidae) from Karwar waters. Indian J. Fish. 35: 164-170.
- Rajani Gopal, V., Ramasubramanian, V., Santhosh, B., and Mathew Abraham, K. 2018. Food spectrum and dietary preferences of the Indian anchovy Stolephorus indicus (van Hasselt, 1823) from Thiruvananthapuram coast, Kerala. Indian. J. Fish. 65: 15-19.
- Raman, K. and Srinivasagam, S. 1978. On new records of the Deep Sea portunid crab, Podophthalmus vigil (Fabricius) from the Ennore and Pulicat estuaries, Madras. J. Inland Fish. Soc. India. 1978: 171-173.
- Rao, L.M. and Rao, P.S. 2002. Food and feeding habits of Glossogobius giuris from Gosthani estuary. Indian. J. Fish. 49: 35-40.
- Razak, M.R.M., Kassim, Z., Sabuti, A.A., and Ismail, A. 2017. Feeding ecology and food preferences of Cherok Paloh, Pahang horseshoe crab, Tachypleus gigas. Mal. J. Fund. Appl. Sci. 13: 465-469.
- Rudnick, D., and Resh, V. 2005. Stable isotopes, mesocosms and gut content analysis demonstrate trophic differences in two invasive decapod crustacea. Freshwater. Biol. 50: 1323-1336.
- Sadeghi, M. S., Pazooki, J., Hosseini, M., and Beni, F. T. 2018. Food supply and influences of reproduction activity on the feeding activity in the blue swimming crab Portunus segnis (Forskal, 1775) from Northwest of Persian Gulf. Indian. J. Geomarine. Sci. 47: 464-468.
- Sahoo, D., Panda, S. and Guru, B.C. 2011. Studies on reproductive biology and ecology of blue swimming crab Portunus pelagicus from Chilika Lagoon, Orissa, India. J. Mar. Biol. Assoc. U. K. 91: 257-264.
- Sajeevan, M.K. and Kurup, B.M. 2013. Evaluation of feeding index of cobia Rachycentron canadum (Linnaeus, 1766) from northwest coast of India. J. Mar. Biol. Assoc. India. 55: 634-639.
- Saker, Y., Chakraborty, S.K., Jaiswar, A.K. and Kumar, P 2013. Food and feeding habits of Priacanthus hamrur from Mumbai. J. Indian. Fish. Assoc. 40: 77-84
- Satapathy, D. and Mishra, S.K. 2007. Growth of mud crab, Scylla serrata in Chilika Lake, East coast of India. Fish. Soc. India. 39: 72-75
- Sattar, S.A. and Adam, M.S. 2005. Review of grouper fishery of the Maldives with additional notes on the Faafu atoll. Marine Fishery Research Centre, Male, Maldives. 54.
- Sharifian, S. and Kamrani, E. 2017. Feeding habits of the freshwater crab Sodhiana iranica from southern Iran. Acta. Limnol. Bras. 29.
- Sourinejad, I., Nikkhah Khaje Ataei, S., Kamrani, E. and Ghodrati Shojaei, M. 2015. Feeding habits of yellowfin seabream, Acanthopagrus latus in the northern region of the Persian Gulf. Caspian. J. Environ. Sci. 13: 31-39.
- Woll, A. K., Van Der Meeren, G. I., and Tuene, S. 2006. Quality improvement by feeding wild‐caught edible crab (Cancer pagurus L.): a pilot study. Aquacult. Res.37: 87-96.