Mini Review - Journal of Neurology and Neurorehabilitation Research (2023) Volume 8, Issue 2
Detection and Classification of Kidney Disease Using Convolutional Neural Networks
Shaikh Abdul Hannan1*, Pushparaj Pal2
1Department of Computer Science and Information Technology, AlBaha University, AlBaha, Kingdom of Saudi Arabia
2Department of ECE, National Institute of Technical Teachers Training & Research Chandigarh, India
- *Corresponding Author:
- Shaikh Abdul Hannan
Department of Computer Science and Information Technology
AlBaha University, AlBaha, Kingdom of Saudi Arabia
E-mail: abdulhannan05@gmail.com
Received: 07-Jan-2023, Manuscript No. AAJNNR-23-85832; Editor assigned: 10-Jan-2023, Pre QC No. AAJNNR-23-85832(PQ); Reviewed: 24-Jan-2023, QC No. AAJNNR-23-85832; Revised: 26-Jan-2023, Manuscript No. AAJNNR-23-85832(R); Published: 31-Jan-2023, DOI: 10.35841/aajnnr-8.2.136
Citation: Hannan AS, Pal P. Detection and classification of kidney disease using convolutional neural networks. J Neurol Neurorehab Res. 2023;8(2):136
Abstract
Chronic kidney disease is a serious, long lasting condition that can be welcomed on by kidney harm or renal disease. In the present status of study, the occurrence of chronic kidney disease (CKD) rises yearly and the numbers of patients are increasing in day to day life because of bad habit and outside food. The capacity of AI calculations to group information with high exactness makes them more vital in clinical determination and a hotspot for future treatment in CKD guess. In the recent past, the effectiveness of feature selection techniques for reducing the amount of the data has been linked to the accuracy of classification algorithms. The batch prediction approach is tested for the detection and classification of chronic kidney diseases in this suggested system's multi-layered convolution neural network (CNN) architecture, which has been trained for the categorization of kidney disorders. The accuracy rate for CNN's classification of CKD ultrasonography is 87.4%. Our inventive model delivered empowering results; they work on the determination of patient circumstances with high precision, decreasing radiologist weight and giving them an instrument that can naturally evaluate kidney condition, bringing down possibility of misdiagnosis. Moreover, working on the norm of clinical consideration and early revelation can change the direction of the disease and drag out the patient's life. The aim of this paper is to detect and classify kidney disease using convolution neural network.
Keywords
Kidney diseases, Convolution neural network, Detection, Classification, CKD.
Introduction
In the human body, the kidneys eliminate waste and pollutions from the blood. Growths (diseases) are brought about by the unusual development of cells, which influences individuals distinctively and brings about different side effects. As a result, reducing the risk of further disease development requires the early diagnosis of kidney tumours (KT) [1]. This ultimately results in the patient's life being preserved. Most diseases do not cause symptoms, while about a third of KT cases are only found after spreading to other places. When individuals are receiving treatment for other illnesses, they are frequently discovered. Coincidental radiographic disclosure of kidney cancers could make patients experience protuberances, kidney pimples, or stomach torment. In all likelihood, the kidneys don't have anything to do with the side effects [2]. In any case, a portion of the more unobtrusive side effects or infections that KT produces incorporate low haemoglobin, shortcoming, spewing, stomach torment, blood in the pee, or high glucose. Moreover, almost 30% of KT patients experience paleness. Sadly, disease habitually creates inside kidney growths and strong masses. The helpfulness of recognizing the cancer is to select the best course of treatment; subsequently, the speed of sickness recuperation might rely upon the growth's initial revelation. A critical organ in the human body, the kidney fills various significant needs. In spite of the fact that kidney ailment is better perceived in industrialized countries, late exploration recommends that the issue is more normal in immature countries [3]. The significant intention is to accumulate waste and additional liquid from the circulatory framework and remove them through the pee created by the kidneys. The amount of poisonous fluids and squanders in our bodies might have terrible repercussions assuming the function of this organ is disturbed. There are two distinct sorts of kidney sickness: intense renal disease and chronic (long haul) kidney disease, and this should be underlined [4].
The main outcomes of this study and organization of article
To propose the of this article is to detect and classify the chronic kidney disease using Convolutional Neural Network (CNN) for the prediction and diagnosis of Chronic Kidney Disease.
To examine the ability to use either blood or urine tests to predict CKD and then assess its precision and applicability [5].
The experimental results has been performed on the Internet of Medical Things platform and the sample datasets has been taken from https://nihcc.app.box.com/v/DeepLesion
The paper is organized as following, in Section II, a brief literature survey on recent related works, and in section III, introduction of Convolutional Neural Network, Section IV, the proposed methodology and preparing Data for underlying neural network. In Section V Results and Discussion, Finally we concluded in Section VI [6-21].
Literature Review
The [22] development of the CKD with many other clinical features is related to epidemiology. In general, nephraphrologists use two tests to check for the use of CKD, blood testing and urine tests. Factors that can affect CKD are genetics, diabetes, obesity, and aging. The blood test tests to check, how well the kidneys filter the blood to eliminate creatinine, a normal muscle breakdown waste [23]. In comparison, the urine test will indicate that protein remains in the urine and In particular, protein (albumin) is a blood component that is usually not transmitted into the urine by the kidney filter [24]. When the urine test indicates that albumin occurs, it means that the kidney filters are damaged and can represent chronic kidney disease. This article describes the prototyping of a wireless embedded health monitoring framework which is used as the IoMT portal. This paper presents multiple models of early prediction kidney disease analytics which could be incorporated into a proposed architectural monitoring system for addressing a lack of health analytics within the existing monitoring system . In general, a patient’s health condition could be tracked or assessed by taking other physiological signs into account. Hence, relying on the physiological parameter of the disease which is inadequate to detect or to predict its occurrence for difficult chronic diseases such as kidney diseases and diabetes.
Guarantee [14] that they utilized data from electronic clinical records to construct a prediction model for the determination of chronic kidney disease (CKD) (EHR). The proposed model encoded and decoded text based and mathematical information from electronic wellbeing records utilizing a neural network architecture (EHR).An AI technique for detecting chronic kidney disease (CKD) in its beginning phases was introduced by J. Qin and partners. They utilized many strategies to fabricate their models, including KNN, the feedforward neural network, guileless Bayes classifier, SVM, random woodland, calculated relapse, and random timberland. The random timberland classification model was viewed as the most reliable, with a rating of 99.75% [3].
Utilized a dataset with 25 credits (14 ostensible and 11 numeric) depicting beginning phases of CKD in Indians, with exactness of 100 percent, responsiveness of 100 percent, and explicitness of 97%, to decide the risk of CKD patients. They recommended that the work ought to be added to the space of medical services and can be utilized for giving ideas in the area by facilitating the finding and therapy of CKD for medical services experts.
In light of an examination research on the UCI dataset [1] explored a computerized ID of CKD with clinical information utilizing Random Woodland (RF), Nave Bayes (ND), and Choice Tree. They computed the heaviness of each component used in the dataset. As per their discoveries, RF has a more prominent exactness in predicting CKD than Gullible Bayes and Choice Tree, which are respectively 96% and 97.5%.
Moreover, Mredhula and Dorairangaswamy played out a review for the distinguishing proof and order of KT utilizing CT scans and both deep learning procedures and traditional AI strategies. For different kinds of kidney cancers, they utilized 28 CT scans, and the dataset was taken from their information base. The division of the dark level pictures gives data, for example, the anatomical structure and the distinguishing proof of the locale important to track down growths, as indicated by their definition. They focused on constructing a self-loader division approach. Also, they set forth an associative neural network (ASNN) model that joined a group feed forward neural network with the k-nearest neighbor (KNN) technique.
All the more as of late, [4] concentrated on the detection of strong renal masses utilizing CT scans and deep learning procedures. On contrast-enhanced computed tomography (CECT) pictures, they ordered RCC from harmless strong renal masses utilizing semi-automated larger part casting a ballot 2D-CNN, completely programmed 2D-CNN, and 3D-CNN. They utilized 315 CT scans, of which 238 were of patients with malignant renal masses and 77 were of patients with harmless strong renal masses. Cuts of the scans were manually made, and each cut's elements were extracted utilizing the CNN model. In view of their exploratory discoveries, the proposed model performed well, with paces of exactness, accuracy, and review for grouping RCC and harmless cancers of 83.75%, 89.05%, and 91.73%, respectively.
Kidney disease and convolutional neural network
Two kidneys, each about the size of a fist, are present in humans. They primarily function as blood filters. They eliminate waste and extra moisture, which produces urine. Also, they make chemicals, direct circulatory strain, and support the body's synthetic equilibrium. The kidneys are hurt and unfit to channel blood as effectively as they ought to because of chronic renal disease. Waste might develop in the body because of this harm, among other possibly perilous medical conditions. Chronic renal disease is most often welcomed on by diabetes and hypertension. Harm to the kidneys happens progressively over an extensive timeframe. Many individuals don't give indications of renal disease until it's far cutting edge. You can see whether you have kidney disease by blood and pee tests. In spite of the fact that kidney disease can't be restored, medicines can help to defer its course. They comprise of medications for controlling circulatory strain, glucose, and cholesterol. After some time, chronic renal disease could deteriorate. Kidney disappointment may rarely be the result. In the event that your kidneys come up short, you'll require dialysis or a kidney relocate.
Convolutional neural networks
As was at that point said, CNN puts together the majority of its consideration with respect to the suspicion that the info will be comprised of visuals. This focuses the architecture's arrangement to best meet the necessities for dealing with the specific kind of information. One of the fundamental varieties is that the layers of the CNN are comprised of neurons organized into three aspects, the spatial dimensionality of the info (level and expansiveness) and the profundity. Convolutional neural networks (CNN) are habitually utilized to extract picture properties and distinguish different objects. A neural network functions as per the weight-sharing idea[7]. Convolution is a critical part of a function that portrays how one function affects another. Different CNNs use different types of activation functions, working layers, and picture sizes and numbers. CNN parameters are chosen experimentally and through making mistakes. In addition, each CNN has a number of layers, the convolutional and sub-sampling (pooling) layers being the most significant.
The Deep Neural Network (DNN) was created by [18] for the distinguishing proof and arrangement of novel renal histologic irregularities. They show that AI with DNN performs well in all cases for handling different histology picture handling tasks. The neural network ordered changes between mice of various genotypes by extracting and utilizing quantitative picture highlights as classifiers. In light of its quantitative imaging highlights, it was exhibited that the division of nonglomerular and the genotype of the animal accomplished great performance. These qualities were not found in an orderly pathologic examination on the Web of Clinical Things stage (IoMT).
Proposed methodology
This section outlines the methods we suggest employing convolution neural network (CNN) architecture for KT identification and categorization [8]. It includes a thorough explanation of our pre-processing procedures, a list of the data augmentation methods we utilised, an illustration of the architecture of the four models we created for KT diagnosis, and other information. To lessen the negative impacts of the injury, lower the number of fatalities, and characterise the tumour kind, we assess the patient's condition Figure 1.

Figure 1: Proposed Methodology.
We want to try a parallel classification approach for kidney growth recognizable proof. In this present circumstance, CNN is utilized to help the embraced CNN model distinguish the element map for each picture associated with the tanning system. To extract a highlighted picture, which will act as the principal feed for the completely connected neural network in the CNN model, we should know the size of the element fragment we are looking for. This might be finished by utilizing the pooling layer [9]. We want to prepare two classes on it, as displayed in Figure 2.

Figure 2: Labels for detection.
Pre-processing
Edges and other spatial details of an image are hidden by speckle artefacts, and irrespective of the picture, speckle noises cover the whole image surface. It reduces the effectiveness of given photos' detection and categorization. This kind of artefact is typically visible in ultrasound imaging as a result of the body's inhomogeneous surface scattering sound waves [10]. The performance of an anisotropic diffusion filter is superior at minimising speckle noise in ultrasound images. In order to produce noise-reduced images, diffusion filters were created via convolution of the input picture with a gaussian kernel.The following equation was used in existing research to suggest the speckle reduction diffusion approach.
 (1)
(1)
Where, c(x,y,t) means the dispersion coefficient, div signifies the dissimilarity administrator, ∇denotes the slope administrator,Δdenotes the Laplacian operator dealing with spatial variables, and I denotes Input Image.
Detection of chronic kidney disease
This study will look for three important kidney diseases: kidney stones, cystic kidney disease, and kidney tumours.
CNN Detection Model: Six deep CNN layers with completely linked ANN make up the proposed model for cancer detection.
The bunch standardization layer and the convolution 2D information layer start things out, standardizing the contributions to every smaller than usual cluster of layers. The Kernel is a convolution mask that can be utilized for edge detection, emblazoning, honing, and different effects. Conv2D utilized various settings special to how it works [11]. The motivation behind the maximum pooling layer is to diminish the result highlights information volume's spatial aspects. The dropout layer additionally adds to decreasing model over fitting. The levelling layer changes over the contribution to the smoothed outcome by then. The feed forward network is then characterized by the thick layer. The quantity of neurons in the result layer intently looks like the quantity of instructional courses [12].
Classification of kidney disease
AI, which is vital for diagnosing clinical imaging, is the beginning of deep learning innovation. In contrast to customary layered architecture, it processes a great deal of stowed away layers. It learns highlights by consuming a sizable measure of named information without utilizing any extraction techniques. One of the characteristic deep learning calculations, CNN, gives the best outcomes on different information bases, including Cifar-10, MS-coco Mnist, and others [13-16].
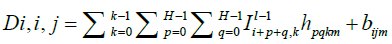
Convolutional neural network (CNN): CNN is a feedforward neural network-based calculation generally used to analyze PC vision-related issues. A shift-invariant complex perceptron is utilized to demonstrate architecture. interconnection of many structural layers based on the human visual cortex. CNN architecture is made out of three essential layers: input layer, stowed away layer, and result layer. The information layer pre-processes the info picture into a uniform level, width, and number of channels while representing the sort of the picture that will be inputted. Convolution activity is shown constantly significant layer. In this layer, cushioning and a range of uniform channels are applied to the info picture. Condition 2 characterizes convolution layer for this review.
 (2)
(2)
Where D_(i,i,j) is the convolution's output, Irepresents the Input Image wherei=1…mandj = 1…n. Input picture line and segment records are addressed by n, weight applied to the convolution is addressed byF_pqkm, and bias applied to the convolution is represented byb_ijm. The formula for padding and striding is 3.
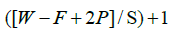 (3)
(3)
Deep learning approaches frequently employ the activation function known as the rectified linear unit (ReLU). Results from using the ReLU activation function to detect multiple sclerosis in CT brain images are significant. Gaining weight with gradient decrease is challenging. ReLU enables the vanishing gradient problem to be reduced if the input has a limited derivative. Equation 4 is used to generate the ReLU activation function.
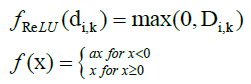 (4)
(4)
Where D_(i,k)connotes the convolutional yield from the channel and the diseased picture and f x indicates the ReLU parametric function. The reason for the pooling layer is to bring down the spatial goal of the convolutional results on each aspect. The most extreme, least, or mean upsides of the kernel in a picture were utilized in the plan of pooling. Convolutional neural networks oftentimes utilize max pooling. We should take a K x K block from the NXN picture. The most elevated esteem is looked over the KXK block and put into a pool. For pooling layer, a 2X2 window is much of the time liked.
Following the convolutional layer's component extraction, the outcomes are handled through a pooling layer prior to being leveled to make a solitary layered vector. 256 level vectors are delivered by straightening a 2X2X64 tangled 2D vector. The last layer, the thick layer, connects the activation function and result from the straightened layer. Each information hub connects to each result hub. The information in the thick layer are standardized utilizing the ReLU activation function, where wk is the weight function that is available in the kth hub of the leveled layer. CNN was utilized in this review to arrange messes into numerous classifications. The prediction class of the Keras model was utilized to prepare the model for the classification of CKD, and it acknowledges prepared information as contribution to the type of Numpy Exhibits. The work of various classes in this work has brought about the planning of different contributions to Numpy exhibits used as dictionaries. During the preparation activities, the class loads are applied to the records of each example. The SoftMax activation function is utilized to sort the likelihood dissemination for each mark. The prediction of NumPy exhibits from the classification results shows the example subordinate class. The Softmax activation include is given by 5.
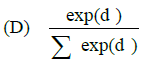 (5)
(5)
Results and Discussion
The major goal of this research is to automatically identify and categorise CKD using ultrasonography B-mode pictures. For the diagnosis and categorization of kidney illnesses, 90 positive ultrasound images with various forms of CKD have been employed. The ultrasound images were obtained through a Philips Mindray -DC 70 ultrasound equipment.
Detection of CKD using CNN: Training and testing phase
At the point when the CNN model was applied, the misfortune came to 0.1682, which addresses the contrast between the issue's actual qualities and the qualities predicted by the model. Precision of the test is 0.9733. Figure 4 shows the precision for every age of the preparation cycle for both preparation and approval.

Figure 3: Flowchart for implementing CNN (Mikhail Dozmorov 2011).

Figure 4: Results of the CNN detection model's evaluation with x axis is epochs and y axis is loss.
F-score diagnostic testing is displayed in Table 1.
| CNN | Precision | Recall | F1 | Accuracy |
|---|---|---|---|---|
| Normal | 0.98 | 0.99 | 1 | 0.99 |
| Tumour | 0.99 | 0.98 | 1 | 0.98 |
Table 1. Results of accuracy of CNN detection model.
The CNN model's training accuracy, which is its accuracy, was 0.99. The test's precision was 0. 9733. Additionally, the loss value denotes the quality of a model's behaviour following each optimization iteration. The CNN detection model's test loss has a value of 0. 1682. We can infer from the earlier findings that the CNN model is highly trained because it excelled throughout testing.
Classification of CKD using CNN: Training and testing phase
The detected ultrasonic section is switched over completely to grayscale for the purpose of preparing and scaled down to 150 × 150 in the two level and width for classification. The primary convolution for the info picture utilizes 34 channels with a 3X3 pixel size and produces 918 boundaries.
ReLU serves as this convolution's activation function. The 2X2 array matrix is maximally pooled with the 2-dimensional vector that results from the convolution layer. The second convolution uses ReLU activation and 32 filters with kernel sizes of 3X3 arrays to create 9450parameters from the generated data. For this convolution, the maximum pooling filter size is 2X2.
The third convolution employs ReLU activation and 66 filters with 3x3 array sizes to produce 20518 2D vectors from the resultant data. The output of the third convolution, which produces 20518 parameters, is again convolved to create 38949 parameters. Using a flattened layer, these 38949 values are turned to a single dimension vector. The output layer for the network design is the last dense layer. On a flattened input vector, the first dense layer performs a nonlinear operation and generates 18469 parameters as the result. Due to the multilayer disease categorization utilised in this study, SoftMax activation is used. It analyses single dimension data as input from a flattened layer. Utilize fit-complied architecture-based data to train the model.
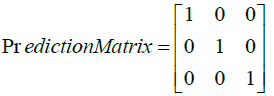
Three categories of 150x150 CKD photos have been placed together as a batch for testing. The prediction matrix is given by, which identifies the prediction matrix with appropriate classes.
Performance analysis
In view of the disarray network, the performance analysis for the expected not set in stone. Determined results for the disarray grid's actual positive, genuine negative, bogus positive, and misleading adverse results are taken from the approval of CKD prediction network. The performance markers have been computed.
Accuracy = TP+TN / (TP+TN+FP+FN)
Precision = TP/(TP+FP)
Recall = TP/(TP+FN)
F score = 2*Precision*Recall / (Precision + Recall)(Table 2)
Correlation of the disarray network and performance measurements among customary and deep learning procedures for arranging CKDs is displayed in Tables 2 and 3 underneath.
| Testing Samples (%) | Training Samples (%) | ||
| 87 | 5 | 4 | |
| 4 | 88 | 4 | |
| 6 | 5 | 85 | |
Table 2. Confusion matrix.
| Classification Methods | Accuracy (%) | Precision (%) | Recall (%) | F-measure(%) |
|---|---|---|---|---|
| SIFT with SVM | 82.6 | 74 | 73.8 | 73.8 |
| SURF with SVM | 84.3 | 83 | 83.25 | 79.63 |
| CNN | 85.21 | 94 | 93.7 | 93.7 |
Table 3. Performance Evaluation for Chronic Kidney Disease Classification (CKDs).
Figure 5 below compares the outcomes of the deep learning method and the conventional way.

Figure 5: Performance table for kidney disease classification.
Conclusion
In this study, we created a CNN-based model for detecting and classifying chronic kidney disease. We employed a dataset that included both healthy and sick kidney disease patients. CNN model is employed for kidney disease detection. The performance accuracy for kidney disease detection has been projected at 0.99%. Convolutional neural networks are utilised for categorization. Convolution layer has output that is shift invariant and directly observes the characteristics from input images. The input photos were processed using three convolutions with several filters. Different epochs are used to fine-tune the training stages. Through the decision matrix, the final results for the classification of CKD are reached and displayed. 87.23% is the performance accuracy for forecasted diseases. To increase CNN's detection rates, a conventional detection scheme may eventually take the place of the existing featured techniques. A better network design with new hyper parameters will also be developed for better classification outcomes.
Our ongoing research will focus on further improving the ability to detect and accurately extract renal tumours from CT scans, as well as creating classification tasks for the tumour subtypes we have identified and performing additional diagnostic studies like dividing tumours into different stages and segmenting those that are in both kidneys. We anticipate a thorough analysis of this new data in order to establish a solid benchmark for the accurate diagnosis of kidney cancers.
References
- Arafat F, Fatema K, Islam S. Classification of chronic kidney disease (ckd) using data mining techniques.
- Cao C, Liu F, Tan H, et al. Deep learning and its applications in biomedicine. Genom Proteom Bioinform. 2018;16(1):17-32.
- Chimwayi KB, Haris N, Caytiles RD, et al. Risk Level Prediction of Chronic Kidney Disease Using Neuro- Fuzzy and Hierarchical Clustering Algorithm (s). J Multimedia Ubiquitous Eng. 2017;12(8), 23-36
- Zabihollahy F, Schieda N, Krishna S, et al. Automated classification of solid renal masses on contrast-enhanced computed tomography images using convolutional neural network with decision fusion. Eur Radiol. 2020;30:5183-90.
- Wang F, He K, Wang J, et al. Prevalence and risk factors for CKD: a comparison between the adult populations in China and the United States. Kidney Int Rep. 2018;3(5):1135-43.
- Jena L, Kamila NK. Distributed data mining classification algorithms for prediction of chronic-kidney-disease. Int j emerg res manag technol. 2015;4(11):110-8.
- Kriplani H, Patel B, Roy S. Prediction of chronic kidney diseases using deep artificial neural network technique. Springer Sci Rev. 2019; 179-187.
- Dorairangaswamy MA. DETECTION AND CLASSIFICATION OF TUMORS IN CT IMAGES. Indian J Sci Technol. 2015;6(2).
- Singh M, Pujar GV, Kumar SA, et al. Evolution of machine learning in tuberculosis diagnosis: a review of deep learning-based medical applications. Electron. 2022;11(17):2634.
- Sokolova M, Lapalme G. A systematic analysis of performance measures for classification tasks. Inf Process Manag. 2009;45(4):427-37.
- Schieda N, Nguyen K, Thornhill RE, et al. Importance of phase enhancement for machine learning classification of solid renal masses using texture analysis features at multi-phasic CT. Abdom Radiol. 2020;45:2786-96.
- Qin J, Chen L, Liu Y, et al. A machine learning methodology for diagnosing chronic kidney disease. J Electr Electron Eng. 2019;8:20991-1002.
- Vasanthselvakumar R, Balasubramanian M, Palanivel S. Pattern analysis of kidney diseases for detection and classification using ultrasound b-mode images. Int J Pure Appl Math. 2017;117(15):635-53.
- Ren Y, Fei H, Liang X, et al. A hybrid neural network model for predicting kidney disease in hypertension patients based on electronic health records. BMC Med Inform Decis Mak. 2019;19:131-8.
- Meenakshi S, Suganthi M, Sureshkumar P. Segmentation and boundary detection of fetal kidney images in second and third trimesters using kernel-based fuzzy clustering. J Med Syst. 2019;43:1-2..
- Santini G, Moreau N, Rubeaux M. Kidney tumor segmentation using an ensembling multi-stage deep learning approach. A contribution to the KiTS19 challenge. 2019.
- Shafi N, Bukhari F, Iqbal W, et al. Cleft prediction before birth using deep neural network. J Health Inform. 2020;26(4):2568-85.
- Sheehan S, Mawe S, Cianciolo RE, et al. Detection and classification of novel renal histologic phenotypes using deep neural networks. Am J Clin Pathol. 2019;189(9):1786-96.
- Vásquez-Morales GR, Martinez-Monterrubio SM, Moreno-Ger P, et al. Explainable prediction of chronic renal disease in the colombian population using neural networks and case-based reasoning. J Electr Electron Eng. 2019;7:152900-10.
- Zhou Y, Xu J, Liu Q, et al. A radiomics approach with CNN for shear-wave elastography breast tumor classification. IEEE Trans Biomed Eng. 2018;65(9):1935-42.
- Mikhail Dozmorov. “Deep learning with R convolutional neural network, images”. Virginia Commonwealth University. 2011.
- Lazich I, Bakris GL. Prediction and management of hyperkalemia across the spectrum of chronic kidney disease. Semin Nephrol.2014;34(3):333-339.
- Chang A, Kramer H. Should eGFR and albuminuria be added to the Framingham Risk Score chronic kidney disease and cardiovascular disease risk prediction. Nephron Clin Pract. 2011;119(2):171-8.
- Liu KD, Yang W, Anderson AH, et al. Urine neutrophil gelatinase–associated lipocalin levels do not improve risk prediction of progressive chronic kidney disease. Kidney Int. 2013;83(5):909-14.
Indexed at, Google Scholar, Cross Ref
Indexed at, Google Scholar, Cross Ref
Indexed at, Google Scholar, Cross Ref
Indexed at, Google Scholar, Cross Ref
Indexed at, Google Scholar, Cross Ref
Indexed at, Google Scholar, Cross Ref
Indexed at, Google Scholar, Cross Ref
Indexed at, Google Scholar, Cross Ref
Indexed at, Google Scholar, Cross Ref
Indexed at, Google Scholar, Cross Ref
Indexed at, Google Scholar, Cross Ref