Research Article - International Journal of Pure and Applied Zoology (2021) Volume 9, Issue 5
COMPARATIVE STUDY OF NUTRITIONAL QUALITIES AND MINERALIZATION OF LACUSTRINE FISH SPECIES IN NIGERIA
Adedokun Mathew Adewale1*, Osuntoki, N. B2
1Department of Animal Health and Production Technology (Fisheries unit), The Oke-Ogun Polytechnic, Saki, Nigeria
2Department of Mathematics and Statistics, The Oke-Ogun Polytechnic Saki, Nigeria
- Corresponding Author:
- Adedokun Mathew Adewale
Department of Animal Health and Production Technology (Fisheries unit), The Oke-Ogun Polytechnic
Saki
Nigeria
E-mail: matdokun@gmail.com
Received: 10th August, 2021; Accepted: 24th August, 2021; Published: 31th August, 2021
Abstract
Highly proteinous food consumed by both young and old populace is fish. Large number of consumers do eat fish because of its availability, palatability, softness and biological values. The quality of nutrients in fish is a function of food and feeding habits and the resident water body. Comparative analysis of the nutritional and elemental compositions of three freshwater species of fish; T. zilli (TZ), P. senegalus (PS) and C. gariepinus (CG), collected from Igboho reservoir, Nigeria, was conducted from April- September. The biochemical study of moisture, protein, fat/lipid, ash contents and mineral elements concentrations; Fe, Na, K and Ca of fish species were carried out in the laboratory. The biochemical assay were determined using loss in weight, micro-Kjedahl, dry- ashing, solvent extraction methods and atomic absorption spectrophotometer. The average moisture contents of the fishes varied from 67.04 to 71.60 (g/100 g) with C. gariepinus having the lowest dry matter content followed by P. senegalus. The protein contents of the fishes ranged from 18.58 to 21.83 (g/100 g). The minimum and maximum protein values were observed for PS and TZ respectively. All the fresh fish types examined are rich sources of moisture, protein, fat, ash and minerals. They all belong to the high-protein (18-22%), high moisture and low-oil (<5%, except TZ) category. Hence, TZ had significant amount of fat (6.38 g/100 g) than that (1.30 and 1.20 g/100 g) of PS and CG at p<0.05. Fat content varied between species examined with significant difference (p<0.05). The pattern of elemental concentrations in fresh fish species was in well-defined decreasing order of Ca>K>Na>Fe. Generally, mineral concentrations group has major and trace elements. In which, major elements (Ca, K and Na) are significantly different (p<0.05). The three fish species are good sources of protein and mineral elements for post Covid-19 food supplements to enhance man?s immunity system.
Keywords
Biochemical compositions, Biological value, Resident water body, Environment, Food and feeding habits
Introduction
Demand for fish has increased tremendously as a cheapest source of animal protein. Fish is highly proteinous food consumed by both young and old. Consumption of fish releases an important nutrient to a greater number of people worldwide and thus makes a very significant contribution to nutrition. However, fish has traditionally been a popular component of diets in many parts of the globe African countries inclusive where it is regarded as the major source of animal protein among rural dwellers (Adesola et al., 2011). Aquatic fin fish has an edge over meat in Nigeria, resulting in large percentage of populace consuming fish because of proteins’ food nature, its availability, and palatability and easily digestible as it contains less collagen fibre than the protein found in meat (Eyo et al., 2001); (Foran et al., 2005). Fish also serves as a favorite foodstuff for large number of people across the globe due to its several health benefits (Ali et al., 2010); (Obaroh et al., 2015); (Job et al., 2015). The principal constituents of fish are; water, protein, fat, ash and carbohydrate. Chemical composition of fish varies relatively with age, season, sex, physiology state of fish, feed intake and the environment (Silva et al., 2000).The knowledge of fish composition is essential for its optimum utilization. It has been reported that proximate composition is a good pointer of physiology required for routine analysis of fisheries (Cui et al., 2011). In addition, the body of fish contains small amount of mineral elements, some of which are essential nutrients, being components of many enzymes system, metabolic mechanisms and hence contributes to the growth of the fish.
Biologically, living organisms require mineral elements for biological functions at moderate levels. The deficiency of the essential mineral element induces series of malfunctioning; reduces productivity, metabolic delay and causes diseases such as inability of blood to clot, osteoporosis impair bone formation, anemia (Fawole et al., 2007); (Adewumi et al., 2014). The most important mineral salts are sodium-Na, Calcium-Ca, Potassium-K, Iron-Fe, Zinc-Zn, Copper-Cu etc. Conversely, when mineral elements exceed metabolic requirement tend to become accumulated in the body tissues of organisms. Heavy metals are non-biodegradable, fish exposed to heavy metals metabolize to a lesser extent and subsequently make the fish unsafe for human consumption.
Various studies have been conducted on the proximate composition of fish species. (Adewumi et al., 2014) worked on the proximate composition of fish species and concluded that all the fish species examined belonged to the high protein (18- 23%) and low oil (<5% except P. obscura), (Watermann et al., 2000) worked on the proximate composition of fish species and resolved that the measurement of proximate profiles is often necessary to ensure that they meet the requirement of food regulations and commercial specifications. Some researchers (Achionye-Nze et al., 2002); (Abdullahi et al., 2006); (Fawole et al., 2007); (Adewumi et al., 2014) have earlier investigated the proximate/mineral contents of some bony fishes in rivers and reservoir in Nigeria and concluded that inland water fishes are good sources of minerals and protein. Observing the nutritional benefits associated with fish consumption and the attendant risk connected to eating fish, it has become justifiable that proximate and mineral compositions of some of the frequently caught fish species in Igboho reservoir be evaluated in order to ensure they meet the requirements of food profiles regularizes and commercial specifications. The most frequently caught fish species sampled and analyzed; Tilapia zilli, Polypterus senegalus and Clarias gariepinus.
Materials and Methods
Area of study
Igboho reservoir is in Oorelope Local Government area of Oyo State, Nigeria. Morphometrical matrices showed that, the reservoir was created in 1987 by the impoundment of Koinsin River (tributary of Ogun River). The river has Ogbagba, Ayinta, Akanso and Owindin as tributaries. It has the catchment area of 248 km2. The reservoir is located in the longitude 3 o 86.7’E and 4 o 00.0’E and latitude 7 o 83.3’N and 7o 93.3’N. The surface area of the reservoir is 300 km2 , while the mean maximum depth is 10 m with total storage capacity of 1, 200, 000 m2.
Collection of specimens
The fresh fish specimens were purchased from the artisanal fishermen at different landing sites, once in a month for a period of 6 months (April-September). Immediately the fish were landed, they were purchased fresh and transported in the ice chest to the central research laboratory University of Ilorin. Fish were washed with chlorinated water, identified using the fish identification guide (Olaosebikan et al., 2013). Necessary morphometric parameters [weight (wt) in g, total length (TL) in cm] were recorded. The fish were processed; de-scaled, gutted and though roughly washed. The whole fish were packed in labelled foil bowls, kept in deep thermo cool freezer at -4oC until needed for further use/analysis.
Biochemical analysis
Proximate and elemental analyses of the samples were carried out in the central research laboratory of the University of Ilorin, using the methods of A.O.A.C (2006).
Moisture
The moisture content was carried out by oven drying a third of each sample in an electric oven at between 70 to 80 oC until the samples had constant or stable weight. The loss in weight was calculated as the moisture content (Fawole et al., 2007); (Victoria et al., 2015).
Protein content
The protein content of each fish was assayed by the micro- Kjeldahl method as reported by (Adewumi et al., 2014). The gram of nitrogen obtained was multiplied by the factor of 6.25 to obtain the protein content of each fish sample.
Lipid (Fat)
The fat content of each sample was determined using the modified Bligh and dyer procedure.
Ash content
The ash content for individual sample was determined by dry-ashing the samples at 5500C for 24 hours. (A.O.A.C, 2005).
Data obtained for protein, fat and ash contents were corrected for moisture and presented on wet weight basis.
Mineral elements
The determination of percentage mineral elemental concentration as well as iron (Fe) were assessed using (AAS) Atomic Absorption Spectrophotometer (Fawole et al., 2007).
Statistical analysis
The data obtained were subjected to one-way analysis of variance (ANOVA). Duncan’s Multiple Range Test was adopted and means were separated at p<0.05 using statistical Package for Social Scientists Computer Software Package (IBM, 2012).
Results and Discussion
The results of both the percentage means of proximate composition and mineral elements concentrations were presented in Table 1. All the biochemical compositions investigated were represented in all the species of studied/ analysed proximate compositions. Moistures, protein, fat (lipids), ash contents were specifically abundant in that order. The fish samples analyzed showed a relatively higher and lower amount of proximate composition; moisture contents follows the order pattern of C. gariepinus>P. senegalus>T. zilli; protein: T. zilli>C. gariepinus>P. senegalus; Fat: T. zilli>P. senegalus> C. gariepinus and Ash content: C. gariepinus>P. senegalus>T. zilli.
| Tilapia zilli | ||||||||||
|---|---|---|---|---|---|---|---|---|---|---|
| Morphometric features | Nutritional qualities | Mineral elements | ||||||||
| Months | TL(cm) | WT(g) | CP | Fat | Moisture | Ash | Fe | Na | K | Ca |
| April | 20.15 ± 1.2 | 250 ± 32 | 21.62 | 6.34 | 67.06 | 1.20 | 0.03 | 3.12 | 4.60 | 13.40 |
| May | 19.52 ± 75 | 241 ± 33 | 21.70 | 6.34 | 67.0 | 1.20 | 0.02 | 3.13 | 3.97 | 13.43 |
| June | 23.12 ± 31 | 285 ± 50 | 21.80 | 6.30 | 66.50 | 1.21 | 0.02 | 3.11 | 4.72 | 13.50 |
| July | 25.21 ± 70 | 280 ± 35 | 21.90 | 6.40 | 67.00 | 1.22 | 0.03 | 3.10 | 4.61 | 13.32 |
| August | 28.11 ± 60 | 337 ± 06 | 22.00 | 6.41 | 67.30 | 1.21 | 0.04 | 3.12 | 4.78 | 13.48 |
| September | 28.52 ± 77 | 310 ± 20 | 22.01 | 6.50 | 67.40 | 1.21 | 0.03 | 3.14 | 4.80 | 13.50 |
| Mean | 21.83 | 6.38 | 67.04 | 1.20 | 0.03 | 3.12 | 4.65 | 13.44 | ||
| Polypterus senegalus senegalus | ||||||||||
| April | 32.12 ± 40 | 250 ± 10 | 18.58 | 1.31 | 71.06 | 3.00 | 0.02 | 3.28 | 4.70 | 10.70 |
| May | 28.75 ± 30 | 232 ± 25 | 18.70 | 1.29 | 71.05 | 3.15 | 0.03 | 3.29 | 4.65 | 10.67 |
| June | 29.72 ± 41 | 320 ± 52 | 18.80 | 1.27 | 71.45 | 3.08 | 0.03 | 3.27 | 4.69 | 10.69 |
| July | 20.60 ± 25 | 195 ± 61 | 19.00 | 1.29 | 70.85 | 3.10 | 0.04 | 3.30 | 4.71 | 10.70 |
| August | 25.35 ± 60 | 315 ± 22 | 18.10 | 1.30 | 70.90 | 3.10 | 0.03 | 3.30 | 4.70 | 10.71 |
| September | 27.10 ± 32 | 302 ± 46 | 19.12 | 1.31 | 71.10 | 3.11 | 0.03 | 3.29 | 4.71 | 10.70 |
| Mean | 18.58 | 1.30 | 71.07 | 3.09 | 0.03 | 3.29 | 4.70 | 10.70 | ||
| Clarias gariepinus | ||||||||||
| April | 34.21 ± 20 | 504 ± 02 | 20.42 | 1.21 | 71.60 | 4.10 | 0.03 | 3.08 | 4.80 | 9.80 |
| May | 51.23 ± 20 | 745 ± 60 | 20.51 | 1.20 | 71.20 | 4.00 | 0.02 | 3.08 | 4.70 | 9.70 |
| June | 35.50 ± 70 | 482 ± 12 | 20.70 | 1.21 | 70.90 | 4.10 | 0.02 | 3.07 | 4.68 | 9.69 |
| July | 34.75 ± 10 | 485 ± 18 | 20.80 | 1.20 | 71.80 | 4.05 | 0,03 | 3.08 | 4.75 | 9.75 |
| August | 47.40 ± 30 | 702 ± 32 | 21.01 | 1.19 | 72.00 | 4.10 | 0.03 | 3.09 | 4.80 | 9.81 |
| September | 43.56 ± 20 | 883 ± 21 | 21.08 | 1.20 | 72.10 | 4.22 | 0.03 | 3.08 | 4.81 | 9.82 |
| Mean | 20.75 | 1.20 | 71.60 | 4.10 | 0.03 | 3.08 | 4.75 | 9.76 | ||
Note: CP-crude protein, Na-Sodium, Fe-Iron, K-Potassium, Ca-Calcium
Table 1: Monthly mean morphometric parameters, nutritional qualities and mineral elements (%) of T. zilli, P. senegalus and C. gariepinus in Igboho Reservoir.
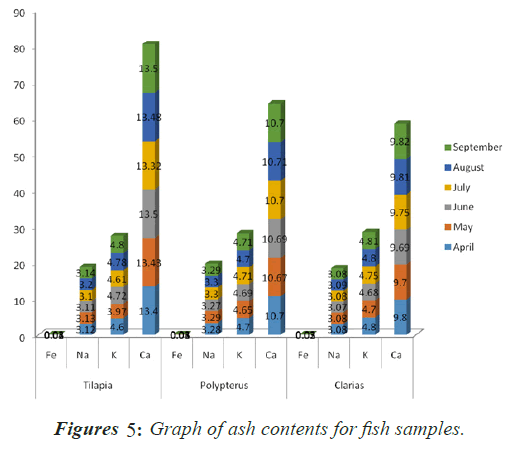
The results of mineral elements are varied in the values obtained significantly. All the mineral elements studied were represented in all the species analyzed. Calcium (Ca), Potassium (K), Sodium (Na) were specifically abundant in the fish analyzed in that order (Ca>K>Na) and Iron (Fe) was negligible.
The morphometric features (Total Length) and weight (Wt/mg) of the fish species collected from Igboho reservoir are shown in Table 1: T. zilli (TL=19.5-28.5 cm; wt=241.0- 310.0 g), P. senegalus (TL=20.6-32.1 cm; wt=195.0-320.0 g) and C. gariepinus (TL=34.2-51.3 cm; wt=482.0-883.0 g). This morphometric information indicated mixtures of juveniles, young adults and adults’ fish were caught using different fishing methods by artisanal fishermen.
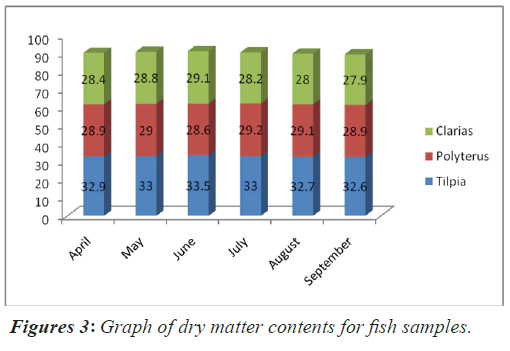
The studied biochemical compositions or qualities in the selected fish species varied considerably in relation to the period of catch. The edible portion of the proximate composition expressed in g/100 g are showed in Figures 1-5. The Figure 3 shows the dry matter contents of the fish species ranged of 27.9 to 32.6 (g/100 g) in decreasing order, the moisture is from T. zilli, P. senegalus to C. gariepinus. The average moisture contents of the fishes was approximately 67.04 to 71.60 (g/100 g). The values of this finding are within the values reported for inland water fishes by Adeola (2011) and Adewumi et al., (2014) for C. gariepinus (65.64 to 80.17); T. zilli (72.30 to 81.00), P. quinquarius (70.48 to 78.59), P. typus (70.24 to 79.38) and 79.38 to 80.32 (C. gariepinus), 77.51 to 77.71 (T. zilli), 79.04 to 80.54 (T. galileus) in Lagos and Osun State respectively.
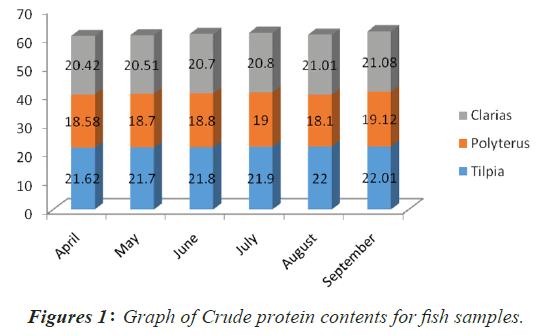
Proteins, fat (lipids) and moisture contents were the major constituents, when assessing the nutritional value of fish. The nutritional elements revealed variable values in all the fishes analyzed, with crude protein showing the highest values and ash contents recording the lowest. This makes the fish a principal candidate of good and dietary protein sources (Figure 1). This is in agreement with the findings of (Vlieg et al., 1988) as reported by (Obaroh et al., 2015) who recorded highest protein contents in fish. The protein contents in the fishes in this study ranged between 18.10 and 22.01 (g/100 g). An indication that they are high protein sources for the consumers. However, the minimum and maximum protein values are recorded for P. senegalus and T. zilli respectively. These values are relatively above those of other fishes. (Palani et al., 2014) reported that the protein content of fatty fishes landed in the Thoothukudi coast of India was 14%. According to (Ondo-Azi et al., 2013) the amount of protein in 5 species of marine fish consumed in Gabon ranged from 16% to 20%. Also, (Fawole et al., 2013) reported protein contents of 6 fresh water fishes from Oba reservoir ranged from 16.91 to 26.18%. (Adesola et al., 2011); (Adewumi et al,. 2014) discovered that the protein contents of freshwater fishes landed in Lagos and Osun inland water ranged from 17.25 to 21.36% and 16.31 to 22.44% respectively. This variations in values of protein contents may be attributed to different resident water bodies (environment).
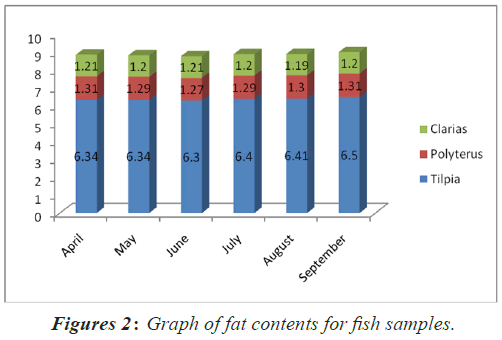
All fish’s types were found to be low in fat content. T. zilli had significantly higher fat contents (6.38 g/200 g) than that of (1.30 g/100 g and 1.20 g/100 g) P. senegalus and C. gariepinus at P<0.05 (Table 1 and Figure 2). The variation in lipid contents among the studied species especially in T. zilli, which was significant may be connected with the fact that T. zilli do store lipid in the muscle to meet its adaptive feature of swiftness as a pelagic fish. However, the values of fat should pose health concern, rather they have curative heart diseases (Victoria et al., 2015). The values range of fat in this study (1.20 to 6.38 g/100 g) disagreed with findings of (Fawole et al., 2013) who reported the fat value ranges among 6 freshwater fishes (5.46 to 18.18 g/100 g) in which H, odoe had the highest fat contents.
The higher the dry matter the lower the moisture content of fish. The highest dry matter was observed in the Tilapia zilli, while Clarias gariepinus recorded lowest dry matter with highest moisture content. The average moisture contents of the fishes ranged from 67.04% to 71.60% (Figure 3). Moisture contents varied among fishes and between resident water bodies. More or less a similar variation in the moisture contents from 62.4% to 81.1% was reported by (Palani et al., 2014).
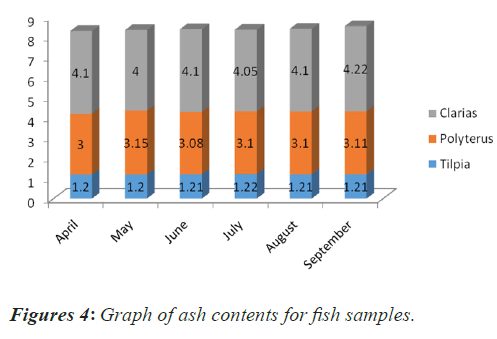
Ash is a measure of the mineral content of food item. The consequential residual balance after organic matter has been burnt off. The observed range of ash content in P. senegalus and C. gariepinus (3.09-4.10%) indicates that species are a good source of minerals; Ca, K and Na. The ash value for the T. zilli (1.20%) is relatively low. These values are higher than what some authors (Baliu et al., 2007); (Narhasan et al., 2008);(Olagunju et al., 2012) have recorded for Channa striatus, Snakehead murrel and Tilapia spp respectively. However, the values for ash content in this study are lower than Ama-Abasi and Ogar (2013) reported for Parachanna obscura (7.76%). The average value of the ash contents for the three fish species is 2.80 g/100 g (Table 1). This values closely disagrees with the range of ash values (1.35-1.66%) discovered for rainbow trout by (Gokoglu et al., 2004) and widely disagree with the range of ash values (7.67 to 10.14%) obtained in 6 fishes from Oba reservoir by (Fawole et al., 2013). Thus, result closely agrees with the range of ash values (0.95–2.50 g/100 g) observed for silver catfish by Weber et al; (2008). The variations could be linked to biological factors and environment (Figures 4 and 5).
Figure 5 shows variations with time (months) in the mineral elements examined for this study. Concentrations of calcium (Ca) were observed to have significantly dominated other studied elements in all the fish samples handled. This is an indication that the resident water body (Igboho reservoir) from which fishes were collected is very rich in calcium and that must have allowed an active movement of this ion across the gill structures which is the functions of its concentration in the external medium (water). Therefore, variations recorded in the value obtained for calcium could be due to an increase in the proportion of bone to flesh as the fishes grow, this agrees with the report or submission of (Boyd et al., 1978) as echoed by (Adewoye et al., 2003). The calcium values levels recorded in all species examined followed specific pattern in decreasing order of T. zilli>P. senegalus>C. garepinus. The high values of calcium (Ca) observed in species of fishes examined; T. zilli (13.44%), P.senegalus (10.70%) and C. gariepinus (9.76%) could probably be linked to the preferential accumulation and calcification of scales and hard tissues (bone). Environmental setting played significant role in the pattern of elemental concentration in each of the species in the order; Ca<K<Na<Fe, contrary to report of some researchers in other localities. (Ako et al., 2004) reported lack of well-defined decreasing order of magnitude in major elements assessed on fish species from another environment. This study agrees with (Adewumi et al., 2014) who reported well-defined decreasing order of Na<K<Ca<Mg<Fe<Mn<Cu<Zn. Minerals help the body grow, develop and stay healthy. Though it is an uncommon occurrence in aquatic systems, fish with diet deficiencies in Ca, K, Na and Fe can experience complications, reduced growth and increased mortality. The elemental concentration in fish could be determined amongst others by microbial activities in the resident water body, feeding habits and age of fish. Hence, variations in the quantification of minerals in fish examined could be due to their abundance in the external medium where they live (Fawole et al., 2013), ability of fish to utilize optimally the elements from their diets and environment and the physiological state of fish (Ako et al., 2004).
Conclusion
The three tropical fish species evaluated in this research are rich sources of biochemical values. This study shows that the nutritional qualities and mineralization of fish species differed and varied significantly (P<0.05) with time. Hence, iron (Fe) values for the three fish species were negligible within the six months of investigation. However, the obtained data would influence customer choice of fish based on their nutritional qualities or values besides supplementing the information on Nigerian food composition database.
References
- Abdullahi, S. A. and Balogun, J. K. (2006). Feed conversion, protein effeiciency, digestibility and growth performance of O. niloticus fed Delonis vegia seed meal. In: Proceedings of the Annual Conference of the Fisheries Soc. of Nigeria. Ilorin, Nigeria.
- Achionye-Nze, G. C., Omoniyi, G. O. (2002). Lipid composition of the fishes Heterotis niloticus, Brycenus nurse, Gnathonemus cyprinoides and Sarotherodon galilaeus. Rev Biol Trop., 50: 353-357.
- Adesola, O. O. (2011). Comparative study of proximate composition, amino and fatty acids of some economically important fish species in Lagos, Nigeria. J Food Sci., 5: 588.
- Adewoye, S. O., Fawole, O. O., Omotosho, J. S. (2003). Concentration of selected elements in some freshwater fishes in Nigeria. Sci Focus., 4: 106-108.
- Adewumi, A. A., Adewole, H. A., Olaleye, V. F. (2014). Proximate and elemental composition of the fillets of some fish species in Osinmo Reservoir, Nigeria. Agriculture and biology. J N Am., 2151-7317.
- Ako, P. A., Salihu, S. O. (2004). Studies on some Major and Trace metals in smoked and Over-dried Fish. JASEM., 8: 5-9.
- Ali, A., Kumars, P., (2010). Chemical and proximate composition properties of different fish species obtained from Iran. World J Fish Mar Sci, (2): 237-239.
- Ama-Abasi, D., Ogar, A. (2013). Proximate analysis of snakehead fish, Parachanna obscura, (Gunther 1861) of the Cross River, Nigeria. J Fish Aquat Sci., 8: 295-298.
- A.O.A.C. (2005). Official Methods of Analysis of Association of Official Analytical Chemists, Maryland, USA.
- Baliu, J. K., Ogu, J., Onwuemme, C. (2007). Condition factor, fat and protein content of five fish species in Lekki Lagoon, Nigeria. Life Sci. 4: 54-57.
- Boyd, C. E., Davis, J. A. (1978). Concentration of selected element and ash in Bluegill (Lepomis macrochirus) and certain other freshwater fish. Trans Am Fish Soc., 6: 862-867.
- Cui, Y., Wotton, R. J. (2011). Effects of ration temperature and body size on the body composition, energy content and condition of the minnow, Phoxinus phoxinus (L). J Fish Biol., 32: 749-764.
- Eyo, A. A. (2001). Fish processing Technology In: the Tropical National Institute of Fisheries and Freshwater Research, New Bussa, Nigeria.
- Fawole, O. O., Oundiran, M. A., Ayandiran, T. A., Olagunju, O. F. (2007). Proximate and Mineral composition in some selected freshwater fishes in Nigeria. J. Food Saf., 9: 52-55.
- Fawole, O. O., Yekeen, T. A, Adewoye, S. O., Ogundiran, M. A., Ajayi, O. E., Nwaiya, M. N. (2013). Nutritional qualities and heavy metals analysis of six fish species from Oba reservoir in Ogbomoso, Nigeria. Afr. J. Food Sci. 7: 246-252.
- Foran, J.A; Carpenter, D. O; Hamilton, M. C; Knuth, B. A., Schwinger, S. J. (2005). Risk-based consumption advice for farmed Atlantic and wild pacific salmon contaminated with dioxins and dioxin-like compounds. Environ. Health Perspect., 33: 552-556.
- Gokoglu, N., Yerlikaya, P., Cengiz, E. (2004). Effect of cooking methods on the Proximate composition and mineral contents of rainbow trout (Oncorhynchus mykiss). Food Chem., 84(1) 19-22.
- IBM, IBM Corporation Release. (2012). IBM SPSS Statistics for Windows, Version 21.0 Armonk, NY: IMB Corp. Open J. For., 9: 5.
- Job, B. E., Antai, E. E., Iniang-Etoh, A. P., Otogo, G.A., Ezekiel, H. S.(2015). Proximate Composition and Mineral contents of Cultured and Wild Tilapia (Oreochromis niloticus) (Pisces: Cichlidae) (Linnaeus, 1758). Pak J Nutr., 14: 195.
- Narhasan, M. (2008). Nutritional composition of aquatic species in Laotian rice field ecosystems:Possible impact of reduced biodiversity. Master’s Thesis, International Fisheries Management University of Troms. P-342.
- Obaroh, I. O., Haruna, M. A., Ojibo, A. (2015). Comparative study on proximate and Mineral Element composition of Clarias gariepinus from the culture and wild sources. Euro Int j basic appl sci., 2: 19-26.
- Olagunju, A. A., Mohammed, S. B., Mada, A., Mohammed, H. A., Muhammed, K. T. (2012). Nutrient composition of T. zilli, H. membranacea, clupea. Harengus and Scromber scrombus consumed in Zaria. World J Medical Sci., 2:16.
- Olaosebikan, B. D., Raji, A. (2013). Field guide to Nigerian Freshwater Fishes. Revised Edition, Printed by REMI THOMAS PRESS (08036275530).
- Ondo-Azi, A.S., Kumulungu, B. S., Mewono, L., Koumba, M. A., Missarg, C. E. (2013). Proximate Composition and Microbiological study of Five Marine fish species consumed in Gabon. Afr. J. Food Sci., 7: 227.
- Palani, K. M, Ruba, A. A, Shanmugam, S. A. (2014). Proximate and Major Mineral Composition of 23 medium sized Marine Fin Fishes Landed in the Thoothukudi Coast of India. J Nutr. Food Sci., 4: 259.
- Silva, J. J., Chaul, R. S. (2000). Composition of marine and fresh water Finfish and Shellfish species and their products. In: Martin, R. E., Carter, E. J., Flick and L. M. Davis (Eds), Marine and fresh water products handbook, Lancaster Pennsylvania, U.S.A. : Technomic Publishing Company, PP: 31-46.
- Victoria, O. E. (2015). Proximate composition of some tropical fish species. Pelagia Research Library. Der Chemica Sinica., 6: 125-129.
- Vlieg, P. (1988). The proximate composition of New Zealand Marine fin fish and shell fish. FAO corporate Document Repository, New Zealand. Ins Crop Food Res., 477-02520.
- Watermann, J. J. (2000). Composition and Quality of Fish. Torry Research Station. Edinburg. 110-113.
- Weber, J., Bochi, V. C., Ribeiro, C. P., Victorio, A. De M., Emmanuelli, T. (2008). Effect of different cooking methods on the oxidation, Proximate and fatty acid composition of silver catfish (Rhamdia quelen) fillets. Food Chem., 106: 140-146.
