Research Article - Journal of Biomedical Imaging and Bioengineering (2019) Volume 3, Issue 1
Colloid Vibration Potential Imaging for Medicine.
Fria Hossein*, Mi WangSchool of Chemical and Processes Engineering, University of Leeds, Leeds LS2 9JT, UK
- Corresponding Author:
- Fria Hossein
School of Chemical and Processes
Engineering University of Leeds
Leeds LS2 9JT United Kingdom
E-mail: py12fah@leeds.ac.uk
Accepted date: 16 December, 2019
Citation: Hossein F, Wang M. Colloid vibration potential imaging for medicine. J Biomed Imag Bioeng. 2019;3(1):114-118.
Abstract
Colloid vibration potential Imaging (CVPI) refers to the signal generated from the vibration of nanoparticles or ions in electrolyte (or tissue), which has a fundamental difference from the conventional ultrasound reflection detection (URD) based imaging technology. In this paper we demonstrate the super capability of CVP signal (or as one dimensional imaging) over the conventional ultrasound imaging. Pork meats were selected and examined with our current CVP instrumentations, and also the conventional ultrasound reflection detection (URD) (Panametrics 5072PR). The additional signatures of CVP measured within the sample/pork reveals the specific physiochemical structures of tissue which the conventional ultrasound technique cannot see. The results, with pervious findings, further support the potential of CVP for providing new and/or complementary knowledge for medicine diagnose and research.
Keywords
Colloid vibration potential imaging, Ultrasound, Medicine, Nanoparticles, Electrolytes, Tissue.
Introduction
The science behind ultrasound can be traced back to Lazzaro Spallanzani, who demonstrated that bats can navigate by inaudible sound. Diagnostic ultrasound within the field of medicine was first used by Karl Dussik in 1942, and later, George Ludwig used ultrasound to study gallstones [1-3]. Ultrasound diagnostic imaging is an imaging technique that can be used to visualize the size and structure of the internal organs of the human body. The principle is that a high-frequency sound wave (typically, 1-6 MHz) is sent through the body by using a probe (transducer). The distances and sizes of the organs can be calculated by the speed of the sound wave through the body, and by the arrival time of the signal. The choice of frequency used can be for high-resolution imaging of for deeper, penetrative imaging.
The concept of ion vibration potential (IVP) for ionic electrolytes dates back to Debye (1933) [4]. The first report on CVP was made by Hermans in 1938 [5], followed by other researchers Rutgers and Rigole in 1957 [6]. The theory of CVP of dilute solutions was first presented by Booth and Enderby in 1952 [7], while early experimental work on colloidal suspensions was conducted by Zana and Yeager (1967) [8].
O’Brien (1987) then developed a model which explained the electric potential generated by the sound wave in colloidal suspensions (O'Brien, 1987). The analytical expressions for both IVP and CVP derived by Ohshima and Dukhin in 1999 [9]. There has also been speculative and experimental work carried out in this field by both Brown University (Vitalyi and Diebold, 2005) and the University of Leeds (Guang et al., 2011). A new UVP testing phantom made from agar, and called the Leeds standard III UVP device for UVP imaging, has been designed, in which electrodes are non-intrusively attached to the body, presented by Hossein and Wang (2019) [10].
This report is to investigate whether CVP signal can be measurable, and the feasibility to be developed as a new functional imaging for medicine diagnose and research. It simplify the approach, pork meats were selected and examined with our current CVP instrumentation and also the conventional ultrasound reflection detection (URD) (Panametrics 5072PR). The discovery of new finding would present specific tissue structures by comparing images of these three modes of tissue information: specified as being ionic vibration based, ultrasound impedance reflection intensity based, and conductivity distribution-based tissue information.
Experiment
The pork meats were bought from a butcher shop in Leeds Kirkgate Market. The meats prepared for the test were cut into a cuboid shape with dimensions. The meat samples consisted of muscle only (M), muscle with fat (MF), and muscle with fat and skin (MFS), small bone with muscle (SMB), and large bone with muscle (LMB). These samples were kept in a fridge at a temperature of 3 for 24 hours before the test. The specific type of tissue (pork tissue) containing sufficient electrolytes (or ionic fluids) and having a difference in physicochemical properties, which might generate a high CVP signal, were preselected for the test (Table 1 and Figure 1).

Figure 1: Pre-selected pork tissue samples for imaging. After the samples were chosen, the experimental work was conducted immediately.
| Sample name | Description | Size (mm)3 | Animal product |
|---|---|---|---|
| M | Muscle | 58 × 28 × 45 | Pork |
| MF | Muscle with fat | 55 × 50 × 46 | Pork |
| LMB | Large bone with muscle | 50 × 68 × 62 | Pork |
Table 1. The specific description of the selected samples. The samples were cut with a sharp knife to give a shape that could easily fit into all the vessels to be used for the test.
Imaging Technique
CV Imaging
We used the Leeds standard II testing facility for both the CVP imaging and the 1D ultrasound reflection detection (URD) imaging. The testing facility consisted of a water tank made from polystyrene with dimensions of width=57, height=80, length=110 mm. We placed a piece of sponge at one end of the tank to absorb ultrasound energy in order to reduce the signal reflection at the other end of the tank. A piezoelectric transducer with a diameter of 25 mm and frequency of 1 MHz was fixed at one side of the water tank. Two electrodes made with aluminium foil and having a square shape and size of 10 × 10 mm, were placed in opposite positions at the far and near side of the water tank. The CVP testing system is shown in Figure 2.

Figure 2: The CVP testing system.
The tank was filled with brine having a conductivity of 4.738 ms/cm. The sample was placed inside the water tank. Four cycles of 1 MHz signals in a duty of 50 ms (0.5% duty-cycle) was set in a function generator (the Agilent 33250A) set with 450 mV(pk-pk) 1 MHz frequency and the signal amplified by the RF amplifier (GA-2500A, RITEC), for up to 40 dB which operate 5 kW with a duty cycle of 0.3%. The output from the RF amplifier was connected to a 50 Ohm impedance matching resistor. The amplified signal was sent through the water tank and the sample via a piezoelectric transducer. The CVP signal was generated by the sample due to the vibration, and the CVP signal was detected by both electrodes and amplified with a voltage amplifier having a gain factor of 39 dB. The signal was then calibrated by an oscilloscope.
URD Imaging
This test was carried out using a similar water tank to the one used in the CVP imaging. The tank was filled with brine having a conductivity of 4.738 ms/cm. The sample was placed inside the water tank. The experiment consisted of two parts: input and output. The input was an ultrasound pulser/receiver (the 5072PR) to produce the ultrasound pulse and receive the reflected signal with amplitude of up to 300 V (pk–pk), with 4 cycles and a 1 MHz frequency. The signal was sent through the water tank via a piezoelectric transducer fixed at one side of the tank and having a diameter of 25 mm, and a frequency of 1 MHz. The reflected signal was measured by the same transducer and amplified by the ultrasound pulser/receiver with a gain factor of 39 dB. The signal was then measured and displayed on the oscilloscope screen (Figure 3).

Figure 3: The ultrasound reflection testing system.
Result and Discussion
Test 1: CVPI: Sample (M):
A pork muscle (M) was placed inside the CVP testing device Rig II. The CVP signal was generated from the sample (M), and the signal-averaged 256 times, and the detected signal was amplified by the voltage amplifier with a gain factor of 39 dB. The signal was then displayed on the oscilloscope and the result is presented in Figure 4.

Figure 4: CVP signal for sample (M).
Figure 4 shows the CVP signal measured from the sample (M) and the signals are generated at the water-muscle interface, the muscle-fat interface, the fat-muscle interface, and the musclewater interface. The thickness of the sample can be measured directly by the following equation:
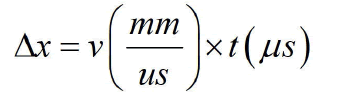
The first pulse cycle of CVP signal appears at each boundary is measured as follows:
x1=42.92 mm, x2=16.28 mm, x3=4.29 mm, x4=4.44 mm
Sample width is Δx=x2+x3+x4=16.28+4.29+4.44=25.01 mm
The internal thickness (1): x3=4.29 mm
The interior thickness (2): x4=4.44 mm
The inner 1 and inner 2 indicates a small layer of fat inside the muscle when anatomically viewed.
Test 1: URD: Sample (M)
The same sample (M) was left inside the UVP standard II testing device. The transducer was connected to an ultrasound pulser/receiver with a gain factor of 39 dB. The URD signal measurement is shown in Figure 5.

Figure 5: Ultrasound reflection detection for sample (M). The first reflected signal appeared at t1=98.5 μs and t2=134.43 μs, and the sample thickness measured at Δx=25.47 mm.
Both imaging tests were carried out using the same sample (M). Four signals were detected inside the sample (M) using the CVP method and only two signals appeared using the URD method. The inside of the sample (M) contains two small layers of fat; this feature was detected by the CVP method while the other method was not able to detect this. The sample thickness was measured as Δx=25.01 mm in the CVP imaging and Δx=25.47 mm in the ultrasound imaging.
Test 2: CVPI: Sample (MF)
A large piece of pork muscle with fat (MF) was placed inside the testing rig. The sample was placed 33 mm away from the transducer interface. The eight bursts of CVP signals were generated by the sample (MF) and measured by both electrodes. The signals were amplified by the voltage amplifier with an amplification factor of 39 dB. The measured signal was displayed on the oscilloscope and the image is presented in Figure 6.

Figure 6: CVP measured from sample (MF).
Figure 6 shows the CVP signal measured for the sample (MF). Eight bursts of CVP signal were measured from the sample. From the detected signals, the first burst and the second burst appear to be mixed due to the frequency issue and thickness of the layer, and the fifth and sixth signals are also mixed due to the same problem. This sample contains multilayer fat and muscles.
x1=32.5 mm, x2=5.55 mm, x3=2.77 mm, x4=5.698 mm, x5=3.988 mm, x6=6.837 mm, x7=11.396 mm, x8=5.698 mm, x9=4.55 mm
The thickness of the sample measured at Δx=46.479 mm. the measured values are x1 is the distance between the first boundary of the sample and the transducer interface into water.
Test 2: URD: Sample (MF)
The same sample (MF) was left inside the UVP standard II testing device. The transducer was connected to an ultrasound pulser/receiver with a gain factor of 39 dB. The ultrasound pulses were sent through the water tank via the same transducer (a 1 MHz piezoelectric transducer, 25 mm in diameter). The reflected signal was collected by the same transducer and displayed on the oscilloscope screen. The measured signal is shown in Figure 7.

Figure 7: Ultrasound reflection from sample (MF).
Figure 7 shows the reflection signal measured for the sample (MF). All the measurements for both CVP and URD imaging are presented in Table 2. In the URD measurements, the attenuation is double that of the CVP because the measurement in CVP is taken directly from the sample, whereas in URD, the measurement is made by the reflection from the sample. As can clearly be seen in figure, there is a big difference between the amplitude between the first signal the last signal, while in CVP it is less attenuated.
| xn | CVP (mm) |
URD (mm) |
|---|---|---|
| x1 | 32.5 | 28.12 |
| x2 | 5.55 | 5.914 |
| x3 | 2.77 | 3.942 |
| x4 | 5.698 | 5.914 |
| x5 | 3.98 | 9.116 |
| x6 | 6.837 | 18.233 |
| x7 | 11.396 | - |
| x8 | 5.698 | - |
| x9 | 4.55 | - |
| Δx | 46.479 | 43.119 |
Table 2. CVP and URD measurement for sample (MF).
Table 2 shows the signal measurement for 1D imaging in both the CVP and URD methods for the sample (MF). The signals are detected and measured x7, x8 and x9in the CVP method, whereas in URD method, these signals are not detected.
Test 3: CVPI: Sample (LMB)
A large piece of pork muscle with the bone (LMB) was place inside the CVP testing rig. The sample was placed 23 mm away from the transducer interface. The ultrasound pulses were sent through the sample via the piezoelectric transducer having 1 MHz frequency and 25 mm in diameter. The CVP signal was generated within the sample and the signal detected by two electrodes placed at the bottom and at the end of the rig. The signal was amplified with an amplification factor of 39 dB and displayed on the oscilloscope. The measured CVP signal is shown in Figure 8.

Figure 8: CVP signal measured for the sample (LMB).
The CVP signal measured x1 at the first boundary of the sample, x2 is the thickness of the muscle from the first boundary to the first boundary of the bone within the sample, x3 is the structure between the bone layers, and x4 is muscle tissue beyond the bone and the end side of the sample. The measured CVPs for each layer are presented in Table 3.
| xn | CVP (mm) | URD (mm) |
|---|---|---|
| x1 | 23.68 | 61.8 |
| x2 | 6.216 | 13.04 |
| x3 | 33.374 | - |
| x4 | 8.306 | - |
| x5 | 4.954 | - |
| Δx | 52.85 | - |
Table 3. CVP and URD signal from the sample LMB.
Test 4: URD: Sample (LMB)
The same sample (LMB) was left inside the UVP standard II testing device. The transducer was connected to an ultrasound pulser/receiver with a gain factor of 39 dB. The ultrasound pulses were sent through the water tank via a similar transducer (a 1 MHz piezoelectric transducer). The reflected signal was collected by the same transducer and amplified with an amplification factor of 39 dB. The URD signal was displayed on the oscilloscope screen, and this is presented in Figure 9.

Figure 9: URD signal measured from the sample (LMB).
In Figure 9 we can see the URD imaging system was only able to detect two signal features. According to the measurements, x1 is the distance between the first boundary of the bone within the sample and the transducer interface and this distance was measured at x1=61.8 mm, this is similar to x3 in the CVP imaging. The value of x2 in figure was measured at 13.04 mm and this is similar to x5 in the CVP imaging.
In both CVP and URD imaging we can see that the CVP can image three different layers such as x1, x2 and x4, whereas the URD was not able to measure any signal within this area of the sample (LMB).
Conclusion
In summary, we have demonstrated the super capability of CVP for tissue imaging in medicine. The CVP signal measured from animal tissue (pork) using our current instrumentations, and demonstrated that, CVP can reveal specific physiochemical structures of colloids or tissue which the conventional ultrasound technique cannot see. The three different samples (M, MF, and LMB) have been tested on CVP imaging and 1D (URD. The discovery of new finding presented specific tissue structures by comparing images of these two modes of tissue information: specified as being ionic vibration based, ultrasound impedance reflection intensity based, and conductivity distribution-based tissue information. This work shows the feasibility of CVP imaging for the potential of tissue imaging in medicine.
References
- Kane D, Grassi W, Sturrock R, et al. A brief history of musculoskeletal ultrasound: ‘From bats and ships to babies and hips’. Rheumatology (Oxford). 2004;43:931-3.
- John G Lynn, Raymund L, Zwemer, et al. A new method for the generation and use of focused ultrasound in experimental biology. J Gen Physiol. 1942;26:179-93.
- Bakeer JB. The history of sonographers. J Ultrasound Med. 2005;24:1-14.
- Debye P. A method for the determination of the mass of electrolytic ions. J Chem Phys. 1933;1:13-16.
- Hermans JJ. Charged colloid particles in an ultrasonic field-II. Particles surrounded by a thin double layer. The London, Edinburgh, and Dublin Philosophical Magazine and Journal of Science. 1938;26:674-83.
- Rutgers AJ, W Rigole. Ultrasound vibration potential In colloidal solutions, in solutions of electrolytes and in pure liquids. Transaction of the Faraday Society. 1957;54:139-43.
- Booth F, JA Enderby. On electrical effects due to sound waves in colloidal suspensions. Proceedings of the Physical Society, Section A. 1952;65:321-4.
- Zana R, E Yeager. Ultrasonic vibration potentials and their use in the determination of ionic partial molal volumes. J Phys Chem. 1967;71:521-36.
- Ohshimaa H, AS Dukhin. Colloid vibration potential in a suspension of soft particles. Journal of Colloid and Interface Science. 1999;212:449-52.
- Hossein F, M Wang. Modelling and measurement of ultrasound vibration potential distribution in an agar phantom. Langmuir. 2019;1:1-18.