Research Article - Journal of Environmental Waste Management and Recycling (2018) Volume 1, Issue 2
An investigation on effective factors on total productivity of water and wastewater industry using multi-criteria decision-making approach (MCDM) (water and Wastewater Company of West Azerbaijan in Iran)
Khosro Alinejad*, Rahim Dabbagh, Nasir Haghkish
Department of Industrial Engineering, Urmia University of Technology, Urmia, Iran
- *Corresponding Author:
- Khosro Alinejad
MSc student
Department of Industrial Engineering
Urmia University of Technology, Iran
E-mail: Khosro.alinejad@yahoo.com
Accepted date: June 30, 2018
Citation: Alinejad K, Dabbagh R, haghkish N. An investigation on effective factors on total productivity of water and wastewater industry using multicriteria decision-making approach (MCDM) (water and Wastewater Company of West Azerbaijan in Iran). J Environ Waste Management and Recycling. 2018;1(2):8-15
Abstract
Nowadays, labor relations, production, and resource constraints become complicated, and achieving growth in organizations by enhancing productivity accounted as most important goals of countries, therefore productivity improvement activities depend on organizations. The aim of this research is to evaluate and assess total productivity (efficiency + effectiveness) in water and wastewater company of West Azerbaijan estate in Iran during a period from 2005 to 2017. Effectiveness assessed by questionnaire tool using Chi-squared test and Efficiency measured and assessed by a variety of expenses, then they prioritized and weighted using Fuzzy AHP model. Finally, by combining these two indicators, total productivity measured. Results showed that between dimensions of effectiveness, the significance of test in provided services, reducing unwanted results and negative effects, level of knowledge and improvement and promotion of the company was more than 0.05, therefore zero assumption based on independence of these dimensions from gender accepted. Also, significance for dimensions of application of information technology and perception and satisfaction of the customer was 0.001 and 0.018 respectively, which was less than 0.05. This indicates a Relation between these two dimensions and gender of staff. In ranking factors affect efficiency, water costs (0.146) and raw material costs (0.145) variables were prioritized. Over the course, productivity had a lot of fluctuation with an average of 58 units, the reason of which was efficiency reduction in energy and capital, however labor efficiency, and effectiveness indicators had a better status than other indicators and had an improving trend.
Keywords
Effectiveness, Efficiency, Productivity, MCDM, Fuzzy AHP
Introduction
Activities of each organization are affected by a set of circumstance and factors that needed to be recognized, investigated and measured to realize goals and optimize activities effectively. Usually, organizations encounter limits like shortage of facilities and resources for their activities. Therefore, they tried to use their limited resources optimally to be capable of competing their rivals and offer their services to customers in low cost with high quality. Since resources are limited and procuring them for organizations is costly, Therefore, it is necessary to maximize using available resources to maximize returns [1], which is possible with organizational efficiency and productivity, because the main goal of productivity and efficiency is an optimal use of resources and facilities. Nowadays, researchers and investigators believe that a country needs capable organizations, systems, human resource and proper planning and resources to acquire high levels of productivity and reach their goals. enhancing productivity is one of the ways to increase production and meet demands of customer [2]. productivity is measuring the amount of workforce, energy and other resources in an organization and is the result of efficiency and effectiveness, in which effectiveness is yield level, and efficiency is fraction ratio of return on the given [3]. To achieve high productivity, a certain ceiling cannot be defined, but companies try to reach the optimized point and see that as their future outlook. In corporations, effectiveness has outward and efficiency has inward look to activities, therefore simultaneously computing effectiveness and efficiency and combining them, make productivity more comprehensive [4]. Sewage network is one of most important infrastructures of community health that keep fresh water away from pollution. Water and wastewater companies constitute economy and industry framework of each country, therefore attending to their continuous improvement will lead to national productivity enhance. in recent years, in almost all efforts to study efficiency, effectiveness, and productivity in corporations, researchers considered productivity as quantitative “efficiency” or as qualitative “effectiveness” and these two dimensions are studied separately. In this study, we investigated productivity “efficiency + effectiveness” in urban water and wastewater corporation of West Azerbaijan in Iran. For this purpose, in the next section, theoretical foundations and research background and in the third section method of implementation are introduced. In section four, results are analyzed and evaluated, and final section a summary of research presented and suggestions proposed for future studies.
Productivity
The word “productivity” in different cultures usually expressed by “processing”, “fertility”, “efficacy”, and “fruition”, and its general definition is the result of dividing outputs on inputs in a production process. Originally, productivity express proper use of available resources in production context and it is the result of dividing outputs on inputs, and with productivity, the organization will have better production function [5]. According to International productivity organization, different products obtained from merging four basic factors of land, capital, workforce, and productivity defined as the ratio of these factors on production which is a criterion to measure productivity. From productivity agency perspective, productivity is level of effective use from production factors. Considering all of the definitions above, a general definition of productivity is the ratio of outputs of a process to its’ inputs. Productivity can be expressed as two subjects of “efficiency” and “effectiveness” that are most important factors affect productivity [2].
Effectiveness refers to adjust results of doing the right thing with desired goals and interests of beneficiaries. In fact, effectiveness is the degree of achieving predetermined goals that measure how to achieve the goals. According to theoretical foundations, effectiveness is concerned with the level of achieving predetermined goals [6]. Parsons also recognized innovation, organizational commitment, job satisfaction and organizational health as effectiveness. French defines effectiveness as the level of realizing organizational goals [7]. Effectiveness is a process that drives organizations to assess organizational progress and achieve organizational goals.
Evaluating effectiveness index requires study of its multiple dimensions, measuring effectiveness is to measure the responsiveness of organizations to needs and demands of customers and citizens. One of these approaches is measuring provided services to the customer, which is very important and has a positive effect on society, measuring customer perception and satisfaction is also one of these dimensions, which play an important role in the effectiveness of organizations [8,9]. There is also a close relationship between knowledge management and organizational effectiveness. importance of acquiring knowledge is that it makes the organization more effective, avoid repeating mistakes, reduce the cost and time of accessing to valuable knowledge within the organization, and transform the organization into a dynamic, competitive and knowledge-based organization [10]. The more knowledge-based infrastructure is reinforced, the more effective role it will play in strengthening the knowledge management process in the organization, On the other hand, the optimal and appropriate use of information technology improve satisfaction, the coherence of programs, speed of work, and quick response to workflow, which result in organizational effectiveness [10].
Efficiency is the concept of doing things the right way and choosing the suitable way of doing things. The goal is to make optimal use of resources in organizations [2]. Efficiency refers to a quantitative increase in goods "tangible goods", In other words, it is defined as the ability to extract more output from less amount of data. From Chan point of view, efficiency is the effective use of resources (labor, machinery, capacity, and energy) [11]. Today, there are several methods and techniques to calculate efficiency, which are chosen according to the purpose and conditions of the systems. The use of multi-criteria decisionmaking models make results of calculating efficiency more scientific, and place the planning process and corrective actions in the context of logical data. In multi-criteria decision making, instead of using an optimality evaluation method, several criteria are used, in which structure is based on mathematics and has high similarity and compatibility with human thinking and mental processes. In these types of models, the opinion of experts and managers can be used to make decisions, because linguistic explanations and considering actual conditions in the model make the results more accurate and efficient. In another approach, efficiency is measured by identifying all returns and dividing them into data, which called total efficiency of all factors (total efficiency). Also, if efficiency focused on a output, it is called partial efficiency.
Literature Review
Ashton examined total productivity of the production factors in the water and wastewater industry in England and Wales with the Translog model In this study, technical efficiency and total efficiency of all factors were investigated and results showed very low levels of efficiency and productivity growth for all factors [12]. Parhizgari and Gilbert, in a research entitled "Measuring Effectiveness and Efficiency in Public and Private Sectors", After identifying and evaluating the effectiveness and efficiency variables in both public and private sectors by statistical analysis, compared these two sections. The results indicate that effectiveness of measures in both the private and public sectors are significant [13]. Fraquelli and Moiso have reviewed the cost-effectiveness and economic scale of the Italian water industry. The results show that in order to economize the scale of activity and optimize the state of this industry, scale and size of this industry should be much larger than the current situation [1]. Marques surveyed the situation of water and wastewater company in portuguese, introduced a competitive model for this organization and suggested to use it in this industry. Also, costs considered as inputs of this model. Their results showed TFP variations were negative in the period of study [14]. Guerrini et al. measured the efficiency of the water and wastewater company in Denmark sewage sector using DEA method. Results showed low productivity level (The variable output to scale ratio is 0.48, the static output to scale ratio is 0.36) [15]. Ambalangodage and Yong have conducted a research called Performance Measurement System (PMS) to improve performance in the framework of employee participation in Sri Lanka Water Company. Purpose of this research was to identify the relationship between employee behavior, organizational capabilities, and organizational performance. The results showed a positive relationship between PMS and their participation in the company [7]. Molinos-Senante et al. investigated productivity evaluation of Chilean water and wastewater companies for quality in service delivery using a method of accounting. The results showed that about one-third of the water and wastewater companies in Chile are completely efficient [16]. Büyüközkan and Karabulut examined energy efficiency in Turkey using AHP method to determine weights and the VIKOR method to rank options [17]. Tang et al. studied total efficiency and productivity based on time series data with DEA model in China. Results showed that total productivity of rural life area factors from 2003 to 2013 was 1.04, which represents a growth rate of 4%. In addition, the metropolitan area has the highest productivity in land utilization (an average of 1.023), then Northeastern Environment Conservation Area (1.004), newly developed urban area (0.998) and environmental protection zone Southeast (0.997). Also, some indices have decreased in this period and there has been an increase in some others [18]. Molinos-Senante et al. surveyed productivity change in water and wastewater industry in England and Wales using Malmquist index, which included capital, labor, and energy costs as inputs and volume of generated water as the output of company in the model. The results showed that during the period from 2001 to 2014, productivity level did not improve significantly.
Research Method
This research has an applied type and survey method, and statistical population in this research was employees of urban water and wastewater companies in West Azarbaijan province. Due to the plurality of indicators, both qualitative approach (data of the questionnaire) and quantitative approach (library documentation data) are used. pairwise comparison matrix which obtained from the questionnaire and quantitative information which obtained from water and wastewater company by collecting experts opinions are used to evaluate efficiency. According to Table 1, to determine the significance of each option, an appropriate questionnaire with five-level fuzzy range prepared and used to define fuzzy numbers in order to make a comparison.
| Linguistic variable | Fuzzy reverse | Fuzzy equivalent |
|---|---|---|
| Equal preference | (1, 1, 1) | (1, 1, 1 ) |
| low preference | (1/2, 2/3, 1) | ( 1, 3/2 , 2 ) |
| preference | (2/5, 1/2, 2/3) | (3/2 2, 5/2 ,) |
| high preference | (1/3, 2/5, 1/2) | (2 , 5/2 , 3) |
| very high preference | (2/7, 1/3, 2/5) | (5/2 ,3,7/2) |
Table 1. Fuzzy numbers corresponding to preferences in paired comparisons.
In order to measure efficiency, factors affect overall efficiency weighted and prioritized using Fuzzy AHP method. The hierarchical analysis process is one of the most comprehensive systems designed for multi-criteria decision making, which provide a possibility to formulate a problem in a hierarchical manner, has a capability of using quantitative and qualitative criteria in decision making, and based on choosing goals and options and paired comparisons. In this method, it is also possible to calculate compatibility of decisions and judge its status. In fact, the AHP method is like human thinking that makes hard and complex decisions easier.
Fuzzy logic was proposed by Professor Zadeh in 1965 to model ambiguity and uncertainty in human perception and thought [19]. Fuzzy characteristics are applicable in many areas of life that are related to judgment, assessment and decision making (Figure 1). One of the fuzzy logic related areas is the natural language in which the meaning of words usually associated with ambiguity. In fuzzy theory, the membership of the members set determined by u (x) function, in which x denotes a distinct member, and u is a fuzzy function that determines the membership degree of x in the respective set.
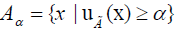

Figure 1: Representation of triangular fuzzy numberM1.
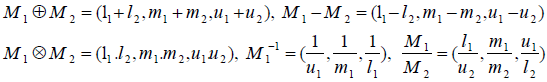
For two fuzzy numbers of M1=(l1,m1,u1,) and M2=(l2,m2,u2,), the operational mathematical rules on fuzzy numbers are defined as:
A fuzzy hierarchy process is a systematic approach that uses fuzzy sets, multi-criteria decision making, and hierarchical analysis structure concepts [20]. This method compares the importance and impact of different factors or options in the form of a pair comparison questionnaire created by experts or decision makers. Different members of the matrix of judgment are fuzzy in the form of a matrix as follow [21].
Now, if there are k experts, integrated opinions matrix of experts will be obtained from the following relationships:
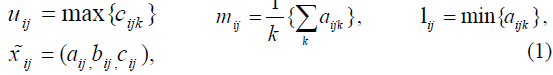
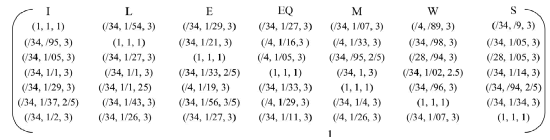
The result of This integration is a fuzzy matrix, and elements of this fuzzy matrix are triangular fuzzy numbers which have respectively the lowest, mean, and the largest value of its corresponding matrix in pairwise comparison matrix of experts. Then, using equation (2), fuzzy matrix numbers are compared with each other.
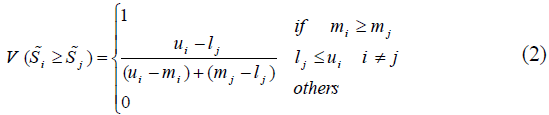
Given the values obtained in the previous step, the degree of
possibility of  calculated over all the other (n - 1) fuzzy
numbers by: (where
calculated over all the other (n - 1) fuzzy
numbers by: (where 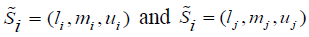 [21].
[21].

j, i = I, L, E, EQ, M, W, S.
To measure effectiveness, data collected using a questionnaire. To determine the validity of questionnaires and their content, questionnaires examined by professors as well as experts from water and Wastewater Company. Based on their views, necessary and effective changes considered. Finally, the questionnaire was prepared with a 5 Likert scale for research. According to the Cochran formula, the sample size was 131 (out of a total of 200 employees). Cronbach's alpha method (with a value of 892) used To assess the reliability of questionnaire, which showed high reliability. In order to calculate effectiveness index and analyze it from data, Chi-squared test was used, which examined the significant difference between the mean of effectiveness dimensions and gender. Then, to measure productivity, at first, average effectiveness dimensions and efficiency results of all factors were standardized on a scale of 0 to 50, and then these two indices were combined to calculate productivity. SPSS23, Excel software used to analyze the data.
Analysis of Data
Effectiveness index and its dimensions indicate the amount of work and activities performed using resources consumed in water and waste water company. These dimensions include measuring provided services, measuring perception and satisfaction of customer, measuring improvement and promotion of the company, measuring reduction of unwanted results and negative effects, measuring the knowledge level and measuring use of information technology. Provided services include efforts of employees to estimate customer needs, quality and quantity of distributed water, the pressure of distributed water, resolve problems by event resolve unit, and so on. Perceptions and satisfaction of customers include guiding managers and staff to solve subscribers problems, comprehensibility of forms and instructions, responding to complaints of subscribers, the proportionality of provided information with needs and responding to requests and needs of subscribers, and so on. Reducing unwanted results and negative effects dimension in the company defined as pollution and damage to the environment, costs of low-quality, excess energy consumption, excessive bureaucracy, and formalities, etc. Also, using information technology dimension in water and wastewater Company defined by the level of using communication network between employees and managers via the Internet, email, chat, telephone, using company site for non-attendance services, doing jobs regardless of time limits set by information tools, travel speed level, information distribution, etc. Level of knowledge dimension in the company included sharing knowledge between employees, applying knowledge in the company, acquiring knowledge, and so on. Company improvement and promotion dimension defined as culture promotion in the company, implementation of projects, environmental protection and sanitation, establishing standards in quality control, protection, safety and health of employees, and so on. In order to calculate the effectiveness index, first, the average of effectiveness questionnaire dimensions calculated and the results are presented in Table 2.
| Effectiveness dimensions | Improvement and promotion of company | Knowledge level | Using information technology | Reducing unwanted results and negative effects | Perception and satisfaction of customer | Provided services |
|---|---|---|---|---|---|---|
| average | 303/3 | 805/2 | 254/3 | 189/3 | 588/3 | 618/3 |
Table 2. Average of effectiveness indices.
In order to investigate the relationship between the effectiveness dimensions and gender in case study company, first, the average amount of each dimension was calculated, then the relationship between the average of these scores and gender calculated using chi-square test and the results presented in Table 3.
| Effectiveness Dimensions | Value | Sig | |
|---|---|---|---|
| Provided Services | Pearson Chi-Square Likelihood Ratio N of Valid Cases |
25/71 34/71 108 |
113/0 112/0 |
| Perception and Satisfaction of Customer | Pearson Chi-Square Likelihood Ratio N of Valid Cases |
88/77 58/78 108 |
018/0 018/0 |
| Reducing Unwanted Results and Negative Effects | Pearson Chi-Square Likelihood Ratio N of Valid Cases |
074/45 47/51 108 |
671/0 416/0 |
| Using Information Technology | Pearson Chi-Square Likelihood Ratio N of Valid Cases |
77/92 4/88 108 |
001/0 004/0 |
| Knowledge Level | Pearson Chi-Square Likelihood Ratio N of Valid Cases |
57/22 8/23 108 |
66/0 65/0 |
| Improvement and Promotion of Company | Pearson Chi-Square Likelihood Ratio N of Valid Cases |
128/51 120/72 108 |
0/326 0/516 |
Table 3. Chi-square test results between staff gender and average effectiveness dimensions.
The significance value of chi-square test in provided services, reducing unwanted results and negative effects, level of knowledge and improvement and promotion of company dimensions was more than 0.05, therefore zero assumption in which indicate independence of effectiveness dimensions from the gender of individuals, accepted. Therefore, there was no difference between various genders of employees in the effectiveness of activities in water and wastewater company. These findings mean gender of individuals (men and women) does not differ significantly in dimensions, and all employees have an effective and decisive role in this regard.
Significance value in using information technology and perception and satisfaction of customer dimensions was less than 0.05, which indicate there are relationships between genders of individuals with these dimensions. Then using the Cramer's V test, the intensity of these relationships calculated.
Table 4 shows the results of the Cramer's V test. Decision criterion for using information technology dimension was 0.001 and for perception and satisfaction of the customer, dimension was 0.018, which was less than 0.05. This mean, there is a relationship between gender of staff and these two dimensions. According to the Table 5, dependence level of a male in the company is higher than that of the female.
| Effectiveness Dimensions | Value | Sig | |
|---|---|---|---|
| Using information technology | Nominal by Nominal Phi Cramer's V N of valid cases |
93/0 65/0 108 |
001/0 001/0 |
| Perception and satisfaction of customer | Nominal by Nominal Phi Cramer's V N of valid cases |
0/85 0/60 108 |
0/018 0/018 |
Table 4. Results of Cramer's V test between gender of staff and effectiveness dimensions.
| Unknown | Woman | Men | Total Staff |
|---|---|---|---|
| 12 | 22 | 74 | 108 |
Table 5. Number and gender of staff.
Efficiency Measurement
Making a right strategic decision about choosing a successful company for investment, require identifying and using criterions that can provide appropriate distinction indices in this context. Hence, corporate executives should recognize the condition in their company and identify factors influence decision-making process then proceed to plan. Rating costs of the company is a very important matter that has a determinative and effective effect in promoting efficiency and productivity. In this research, judgments of 16 experts from managers and technicians of the urban water and wastewater company for seven variables (capital expenditure I, labor costs L, energy costs E, equipment costs EQ, raw material costs M, water costs W and Sewage sector costs S) has been shown and prioritized. In order to increase
In Matrix A and other expert opinion matrices, property  is maintained. In order to calculate weights for each
of options, combined weights are calculated for each of the
options. To do this, at first, elements of each row of matrix A
calculated using the sum of triangular fuzzy numbers to form a
columnar fuzzy matrix (column x1 in Table 6). Then, elements
of columnar matrix summed up to obtain a fuzzy number (line
x3). This number was reversed (line x4), and then elements of
the columnar matrix (x1) were multiplied by the inverse of the
fuzzy number (x4) to obtain the relative weight of costs (column
x2). The results of these calculations are presented in Table 6.
is maintained. In order to calculate weights for each
of options, combined weights are calculated for each of the
options. To do this, at first, elements of each row of matrix A
calculated using the sum of triangular fuzzy numbers to form a
columnar fuzzy matrix (column x1 in Table 6). Then, elements
of columnar matrix summed up to obtain a fuzzy number (line
x3). This number was reversed (line x4), and then elements of
the columnar matrix (x1) were multiplied by the inverse of the
fuzzy number (x4) to obtain the relative weight of costs (column
x2). The results of these calculations are presented in Table 6.
| costs | sum up each row of Matrix A | relative weight of costs (x2) | |
|---|---|---|---|
| SI | capital expenditure | (3/1, 7/947, 19) | (0/0238,0/1415,0/8804) |
| SL | labor costs | (3/16, 7/681, 19) | (0/0243,0/1367,0/8804) |
| SEQ | energy costs | (2/98, 7/301, 18/5) | (0/0229, 0/1301,0/8572) |
| SEQ | equipment costs | (3/04, 7/792, 17/5) | (0/0233, 0/1387, 0/8109) |
| SM | raw material costs | (3/1, 7/803, 18) | (0/0238, 0/1389, 0/8341) |
| SW | water costs | (3/1, 9/385, 19) | (0/0238, 0/167, 0/8804) |
| SS | Sewage costs | (3/1, 8/174, 19) | (0/0238, 0/1455, 0/8804) |
| The sum of the columns of the matrix) x3 ( | (21/58, 56/092, 130) | ||
| ( x4) Inverse the sum of the columns in the matrix | 0/0076, 0/0178, 0/0463) ) | ||
Table 6. Calculation of weights for each cost.
Now using Equation (4), the relative weights of the costs of the
above table are compared with each other in which 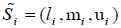
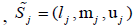 and j, i = I, L, E, EQ, M, W, S are defined.
Therefore, we have:
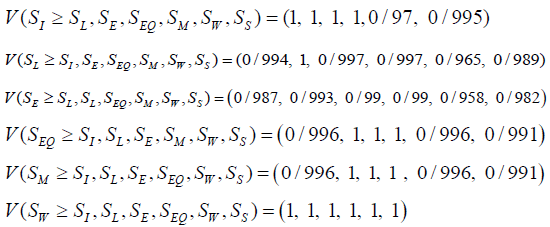

In the following, the importance of options determined according to (5). Considering values obtained in the previous step, the smallest amount of possible degree of corresponding combination size of each of the options being larger than corresponding combined size of other options selected (after comparing the values obtained for each cost compared to other costs, the lowest amount selected). So we have:
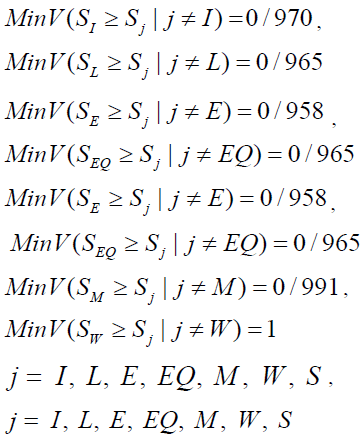
The values obtained are the weight of the costs: W= (0/970, 0/965, 0/958, 0/965, 0/991, 1, 0/975)
After normalizing these costs, final weight of the costs and their prioritization, presented in Table 7.
| costs | final weight | prioritization | |
|---|---|---|---|
| Unit water | WW | 146/0 | 1 |
| raw material | WM | 145/0 | 2 |
| wastewater | WS | 143/0 | 3 |
| capital | WI | 142/0 | 4 |
| labor | WL | 141/0 | 5 |
| equipment | WEQ | 141/0 | 6 |
| energy | WE | 140/0 | 7 |
Table 7. Weights and priorities of costs using the fuzzy method.
According to results of rating company expenses in Table 7, considering financial constraints of the company and allocating costs according to ranking can become a tool to control costs and pay more attention to necessary and unnecessary expenses incurred in the company without harming main functions of it. Now, these coefficients can be used to determine intensity and contribution of each cost in total factor efficiency. So we have:

The proposed model used to calculate the total efficiency of factors using expert's opinions through rating costs (of production factors) of water and Wastewater Company. Due to efficiency measurement uniformity, the proposed model can be used as a general formula for calculating efficiency in water and wastewater companies and other organizations. The most important feature of this model against other efficiency indices is that weights of inputs in the company are not equal, and their coefficients are not 1. In many organizations and companies, the importance of different factors varies from each other. Therefore, the result of considering same weights in the calculation of efficiency indices may show unrealistic quality and desirability. Therefore, this model will be able to analyze the situation in the company by calculating efficiency more accurately, and it can manage and identify strengths and weaknesses in the company and create corrective programs to improve and increase activities. therefore, important issues are to identify how costs impact the performance of the company and effective and efficient use of costs in companies how can improve efficiency and thereby improve productivity.
In order to analyze and assess efficiency, the most appropriate indices selected based on the definition of efficiency (ratio of the value of goods and services to expenditures). Considering the factors of production (labor, capital, and energy), the partial and total efficiency of the factors investigated. Output value in the water and waste water company is the sum of values of employee service compensation, intermediate consumption, and fix asset consumption. Costs of energy include all energy carriers (electricity, gas, etc.) in terms of monetary unit; also, capital costs are measured by fixed assets (buildings, facilities, equipment, incomplete assets, etc.). Labor costs include salaries, cash, and non-cash benefits, etc, which considered for each employe.
According to Table 8, total efficiency of factors in the company fluctuate (0.50 units in 2005, 0.3 units in 2014 and 0.47 units in 2017), in a way that total efficiency average is 0.44 units, and one of the factors of this decline is capital (with a mean of 0.44 units) and energy efficiency (0.45 units). Also, comparing costs and output indicate that growth in energy and capital costs is higher than the value of output in the company.
| Efficiency indices | Total Factor Efficiency (TFE) | Energy efficiency | Labor efficiency | Capital efficiency |
|---|---|---|---|---|
| Year | Output energy costs | Output labor costs | Output capital costs | |
| 2005 | 50/0 | 40/0 | 62/0 | 35/0 |
| 2006 | 55/0 | 46/0 | 70/0 | 42/0 |
| 2007 | 56/0 | 51/0 | 67/0 | 48/0 |
| 2008 | 50/0 | 49/0 | 66/0 | 42/0 |
| 2009 | 51/0 | 61/0 | 65/0 | 44/0 |
| 2010 | 50/0 | 60/0 | 57/0 | 52/0 |
| 2011 | 43/0 | 64/0 | 51/0 | 36/0 |
| 2012 | 46/0 | 59/0 | 54/0 | 48/0 |
| 2013 | 34/0 | 34/0 | 71/0 | 65/0 |
| 2014 | 30/0 | 36/0 | 64/0 | 27/0 |
| 2015 | 30/0 | 27/0 | 55/0 | 37/0 |
| 2016 | 32/0 | 32/0 | 45/0 | 34/0 |
| 2017 | 47/0 | 45/0 | 63/0 | 62/0 |
| Average | 44/0 | 45/0 | 61/0 | 44/0 |
Table 8. Indicators of total and partial efficiency of factors during the period.
Measuring Productivity
To unscale the results of efficiency and effectiveness and sum up them to calculate the productivity using relationship (Z50= ((x-min)/ (max-min))*50)), all ratios converted to numbers between 0 and 50 [22] and results presented separately.
It should be noted that due to unscaling of the Figures 1 and 2, data in the Tables 9 and 10 cannot be analyzed. Total efficiency and effectiveness indices unscaled in a range from 0 to 50 and have additive property. Therefore, their composition is feasible, the results of which are given in Table 11.

Figure 2: Total factor productivity during the course.
| Efectiveness dimensions | Improvement and promotion of company | Knowledge level | Using information technology | Reducing unwanted results and negative effects | Perception and satisfaction of customer | Provided services |
|---|---|---|---|---|---|---|
| Average | 290/3 | 889/2 | 280/3 | 345/3 | 570/3 | 607/3 |
| Average in a scale of 0 to 50 | 924/27 | 0 | 228/27 | 754/31 | 423/47 | 50 |
Table 9. Converting average of effectiveness indices to a scale of 0 to 50
| Year | 2017 | 2016 | 2015 | 2014 | 2013 | 2012 | 2011 | 2010 | 2009 | 2008 | 2007 | 2006 | 2005 | |
| Total efficiency to a scale of 0 to 50 | 64 | 35 | 31 | 31 | 37 | 61 | 56 | 69 | 72 | 69 | 81 | 78 | 70 | |
Table 10. Converting total factor efficiency index to a scale of 0 to 50.
| Year | 2017 | 2016 | 2015 | 2014 | 2013 | 2012 | 2011 | 2010 | 2009 | 2008 | 2007 | 2006 | 2005 |
| Total Factor productivity | 64 | 35 | 31 | 31 | 37 | 61 | 56 | 69 | 72 | 69 | 81 | 78 | 70 |
Table 11. Total factor productivity during the course.
The productivity level has many fluctuations during the period (2005 with 70 units, 2014 with 31 units and 2017 with 64 units), in which energy and capital indices, compared to labor productivity indices, are factors of productivity changes. Average energy efficiency was 0.45 units, which means energy efficiency in the current situation has a positive impact on the provided goods and services but its impact on productivity is low. One of the main reasons for this is that there have been many changes in energy costs due to rising energy prices over the years. In order to improve this index, saving energy with new and upgraded equipment, choosing the best and low-consuming and technically appropriate equipment in future projects, optimizing energy consumption equipment in the company is suggested that reduce costs. The efficiency of labor force with an average of 0.61 unit has a more significant effect than other factors on productivity, but to improve this index it is necessary to employ employees based on their expertise. Also, the average efficiency of capital was 0.44 units, and to improve this index, changing capital and investment in the company suggested, which could improve total efficiency.
Conclusion and Suggestions
To achieve productivity, a certain amount and ceiling cannot be defined, but what matters is to reach a milestone that companies are trying to achieve and know it as their prospect. Productivity is the coordination of quality, quantity, and costs in competition, and increasing productivity is one way to increase production and meet demands of people. Productivity measures the status of labor productivity, capital, energy, and other resources of an organization, and is the result of efficiency and effectiveness; effectiveness defined as the level of return, and efficiency is the ratio of output to data. Effectiveness and efficiency are two main dimensions of productivity measurement, none of which alone completes productivity, while in most studies, productivity is only measured through efficiency. In companies, effectiveness has an extroverted and efficiency has an introverted look to activities, therefore calculating efficiency and effectiveness simultaneously and combining them together make productivity more comprehensive. Effectiveness results in Urban Water and Wastewater Company show that the relationship between gender of employees and the dimensions of effectiveness (knowledge level, improvement and promotion of the company, reducing unwanted results and negative effects and provided services) are known to be independent from gender of individuals. Hence, there is no difference between genders of individuals in creating effectiveness in any of these dimensions. However, there is a significant relationship between gender of staff and use of information technology, and perception and satisfaction of customer's dimensions, which with Kramer's v test, the severity of this correlation was respectively obtained 0.93 and 0.85. Inefficiency section, factors affect efficiency prioritized and weighted using the Fuzzy AHP approach, in which water costs (with a weight of 0.146) and raw materials (with 0.145) are in top priority. Then, using obtained weights, a model for calculating total efficiency presented, which in comparison with other models that calculate efficiency, has this superiority that does not take all the inputs of the company into account with the same importance, and each input introduced(entered) into model according to its effect. Then partial and total efficiency of all factors calculated during the period of 2005 to 2017. The results showed that total efficiency of production factors of the company had fluctuations; an average efficiency of all factors with the effect of fuzzy weights was equal to 0.44 units. Reasons for this decrease are low efficiency in energy and capital sectors. Level of productivity during the period had a lot of fluctuation with an average of 58 units, which energy and capital efficiency indices in comparison with labor efficiency and effectiveness indices were factors of productivity changes. According to the results, in order to improve total productivity of the company, establishing productivity improvement management cycle (1- productivity measurement, 2-productivity assessment and analysis, 3- productivity improvement planning, 4-productivity implementation) suggested. Also, it is suggested that efficiency indicators for energy (energy saving, equipment optimization, optimal and low consuming and technically appropriate equipment selection), capital (capital and investment change), and labor force (employing employees based on expertise, creating appropriate ground for innovation and creativity of staff, continuing job training), to be planned and implemented as a permanent process according to mechanisms that are proportionate to situation of company. To allocate appropriate weights to inputs and outputs for the DEA model using AHP approach to rank performance, suggested for future research.
References
- Fraquelli G , Moiso V. Cost Efficiency and Scale Economies in the Italian Water Industry. Higher Education and Research on Mobility Regulation and the Economics of Local Services (HERMES), Working Paper. 2005; 8.
- Fullard F. A model to evaluate the effectiveness of enterprise training programmes. International Entrepreneurship and Management Journal. 2007; 3(3):263-76.
- Asian Productivity Organization (APO). 2016.
- Ilgen D R, Klein H J. Individual motivation and performance: Cognitive influences on effort and choice. Productivity in organizations. 1988; 143-76.
- Pritchard R D. Productivity measurement and improvement: Organizational case studies. Greenwood Publishing Group. 1995.
- Rajasulochana P, Preethy V. Comparison on efficiency of various techniques in treatment of waste and sewage water–A comprehensive review. Resource-Efficient Technologies. 2016; 2(4):175-84.
- Ambalangodage D, Yong G D. "Performance Measurement System and its Contributions to Improve Performance: In the Context of Sri Lankan Water Board". Global Journal of Contemporary Research in Accounting, Auditing and Business Ethics. 2016; 2(1).
- Pekkola S. Managing a network by utilizing performance measurement information. Measuring Business Excellence. 2013;17(1):72-9.
- Laihonen H, Sillanpää V. What is the Role of Knowledge Management in Establishing the Effectiveness of Public Welfare Services? Knowledge and Process Management. 2014;21(2):112-121.
- Chidambaranathan K, Swarooprani B. Knowledge management as a predictor of organizational effectiveness: the role of demographic and employment factors. The Journal of Academic Librarianship. 2015;41(6):758-63.
- Chan F T. Performance measurement in a supply chain. The international journal of advanced manufacturing technology. 2003;21(7):534-48.
- Ashton J K.Total factor productivity growth and technical change in the water and sewerage industry. The Service Industries Journal. 2000;20(4):121-130.
- Parhizgari A, Gilbert G R. Measures of organizational effectiveness: private and public sector performance. Omega. 2004;32(3):221-29.
- Marques R C. Measuring the total factor productivity of the Portuguese water and sewerage services. Economia Aplicada. 2008;12(2):215-37.
- Guerrini A, Romano G, Leardini C et al., Measuring the efficiency of wastewater services through data envelopment analysis. Water Science and Technology. 2015;71(12):1845-51.
- Molinos-Senate M, Donoso G, Sala-Garrido R. Assessing the efficiency of Chilean water and sewerage companies accounting for uncertainty. Environmental Science & Policy. 2016;61:116-123.
- Büyüközkan G, Karabulut, Y. Energy project performance evaluation with sustainability perspective. Energy. 2017;119:549-60.
- Tang D, Tang J, Xiao Z. et al., Environmental regulation efficiency and total factor productivity—Effect analysis based on Chinese data from 2003 to 2013. Ecological Indicators. 2017;73:312-18.
- Sets F, Zadeh L. Information and Control.–NY, 1965;8(3):338-53.
- Chang D Y. Applications of the extent analysis method on fuzzy AHP. European journal of operational research. 1996;95(3):649-55.
- Wang Y M, Luo Y, Hua Z. On the extent analysis method for fuzzy AHP and its applications. European Journal of Operational Research. 2008;186(2):735-47.
- Mohamad I B, Usman D. Standardization and its effects on K-means clustering algorithm. Research Journal of Applied Sciences. Engineering and Technology. 2013;6(17):3299-3303.