Research Article - International Journal of Pure and Applied Zoology (2021) Volume 9, Issue 1
ABO AND RH (D) BLOOD GROUPS DISTRIBUTION IN PAKISTAN: A SYSTEMATIC REVIEW
Ghani Ur Rehman*
Yunnan Key Laboratory of Primate Biomedical Research, Institute of Primate Translational Medicine, Kunming University of Science and Technology, Kunming, Yunnan, China
- Corresponding Author:
- Ghani Ur Rehman
Yunnan Key Laboratory of Primate Biomedical Research
Institute of Primate Translational Medicine
Kunming University of Science and Technology
Kunming, Yunnan, China
Received date: 15th December, 2020; Accepted date: 6th January, 2020; Published date: 12th January, 2021
Abstract
The abo blood group system was the first discovered human blood type in 1901 by Land Steiner. The ABO and Rh system is a clinically significant blood group system and extensively recognized in medical and anthropological studies, among 29 human blood group systems. The study aims to determine the frequency distribution of ABO and Rhesus (Rh) blood group system in all-region and provinces of Pakistan. According to this study, the sequence distribution of the ABO blood groups in the Pakistani population is B with frequency (33.37%), followed by O (33.14%), then A (33.99%), and AB (9.74%). The phenotypic frequency observed was 0.2399, 0.3337, 0.0974, and 0.3314 for blood groups A, B, AB, and O, respectively. While for Rh (D) positive and negative, it was 0.9063 and 0.0937, respectively. The study concluded that blood group B is most prevalent, while group AB is the least prevalent. Rh-positive is commonest while Rh-negative is the rarest blood group in Pakistan.
Keywords
ABO; ABO blood group system; RhD
Introduction
The blood group system of ABO was first discovered mechanism in human blood type in 1901 by Land Steiner (Garratty et al., 2000). Later, Landsteiner and Wiener found Rhesus (Rh) blood types in 1939 (Garratty et al., 2000; Mollison, 1994). The ABO system classifies blood into A, B, AB, and O. The blood group system for Rhesus (Rh) was established in 1941, with Rh-positive and Rh-negative streams on the surface of the red blood cells (RBCs) dependent on the frequency and absence of inherited antigenic substances such as proteins, carbs, glycoproteins and Glycolipids (Kondam et al., 2012). The ABO and Rh system is a clinically significant blood group-system among 29 human blood group systems, despite the discovery of numerous other markers such as microsatellites or groups (Amin-ud-Din et al., 2004; Armstrong et al., 2008; Begum et al., 2011; Hosoi, 2008). These are extensively recognized in medical and anthropological literature (A.u. Rehman et al., 2014). For safe blood transfusion and organ transplantation, ABO and Rh blood group systems are critical. Moreover, both systems are well known in population genetic research, population migration processes, investigation of decision-making forensic cases, and disputed paternity matters (Mondal et al., 2012; Pennap et al., 2011). Besides, blood groups are thought to be associated with different disorders such as salivary gland tumors, carcinoma, stomach carcinoma, thyroid disorders, small cell lung cancer, and cardiovascular disease (Cerny et al., 1992; Pinkston et al., 1996). The types of blood groups are hereditary. ABO blood groups are regulated by a single gene having three alleles found on chromosome 9. Rh blood group system inheritance is dependent on the existence of either R or r alleles (Shaheen et al., 2014). All human species have the same blood grouping system, with significant variations between frequencies' different incidence. The prevalence and frequency distribution of these blood groups among various cultures and races need to be understood. The occurrence of ABO and Rh blood groups among the Pakistani population indicates a marked variance, suggesting racial variations, ethnic as well as genetic differences of the Pakistani community (Hemalatha et al., 2015; Ilyas et al., 2013; Khattak et al., 2008).
The distribution of blood types across various ethnic groups and races varies worldwide (Sidhu et al., 1980). It may vary in different populations and from one region to another in the same country. The world population is split into several ethnic groups. It is considerable to which these groups vary in terms of solely hereditary characteristics. Blood groups may be used as an easy and effective technique for this purpose. The relative prevalence of blood groups O, A, B, and AB in Western Europe is 46%, 42%, 9%, and 3%, respectively (Guyton et al., 2000). The distribution of blood groups O, A, B, and AB in the United States is 45%, 41%, 10, and 4%, respectively (Hassan et al., 2010). Eastern Europe shows a higher blood group B percentage. Pure American Indians belong to group O, almost exclusively (Begum et al., 2011). Blood group B frequency in Central Asia is the highest (Hassan, 2010). In Britain, Rh-negative is most frequent (17%), followed by Caucasoid (15%) less common in American Blacks (5%), in African Blacks the ratio is (0%) and very rare in Asians (1%) (Mahmood et al., 2004).
Pakistan, officially the Islamic Republic of Pakistan, located in South Asia, is the world's fifth-most populous country with a population exceeding 220 million. It has the world's secondlargest Muslim population. Pakistani community comprises 97% Muslims while small non-muslims religious groups like Christians, Hindus, Sikhs, Qadianis, Parsis, and others 3%. Pakistan is an ethnically diverse population; among them, the largest ethnic group is Punjabi 44.15%, followed by Pakhtun or Pashtun 15.42%, Sindhi 14.1%, a transitional ethnic group between Punjabi and Sindhi making 10.53%, the Muhajir 7.51%, Balochi3.57%, and the other groups of northern areas make up roughly 4.66%of the total population. (Haruechaiyasak & Damrongrat, 2008). Previous research studies on the distribution of ABO blood groups studied only small regions or with few sample sizes. However, as to our knowledge, no study is made to analyze the distribution of ABO blood group system in all the areas of Pakistan. Therefore, this systematic analysis is the first attempt to examine the frequency distribution of Blood groups over 21 years span between 1999 to 2020. We attempted to quantify the frequency distribution and allelic frequency of ABO and Rh(D) blood groups in Pakistan from reported studies.
Materials and Methods
The literature search and research strategy was developed for the assessment of the ABO system distribution in Pakistan.
An online search for literature
Various search engines were used for this systematic review; this includes Google Scholar, PubMed, Science Direct, SciHub, Medscape, Web of Sciences, etc. The term and keywords searched to obtain the desired literature were Blood Group, Prevalence/Distribution/Frequency of the ABO blood group, Rhesus blood group system, and various Pakistan regions. The publication year for the literature search was restricted from January 1999 to September 2020. We expected the lack of apparent accuracy of the information, so no form of publication was prohibited. Conditions for the inclusion of studies are that:
1) Article must be written and published in the English language 2) Studied population must be Pakistani. 3) The published paper must be between 2001 to 2018. 4) Calculation of frequency distribution of ABO and rhesus blood group should be the core primary findings of the study. 5) Research article, review papers letter to the editor, and abstracts relevant to the distribution of ABO should be included.
Assessment of article and classification
We divided the state of Pakistan into six regions, which include four provinces of Khyber Pakhtunkhwa, Punjab, Sindh, Balochistan, and two autonomous territories of Azad Jammu and Kashmir and Gilgit Baltistan. Details are given in Table 1. For the analysis of national statistics, the number of individuals from various areas of the same blood groups was analyzed. The number of individuals from different regions with the same blood groups was added to explore the national data with the percentage frequency distribution of ABO blood group system in Pakistan.
Allele frequency
For the allelic frequency estimation, hardy Weinberg quantitative genetics equilibrium was used (Dabholkar, 1999). The overall likelihood ratio was also estimated by this approach, supposing that the ABO system is represented by a single gene having three alleles named as A, B, and O; both A and B are autosomal-dominant over O, and both A and B are codominant. The expected phenotypic frequency was estimated based on the blood allelic frequency results. We conducted the Chi-square test to determine the genotype frequencies the independence goodness of fit for gene (Gupta, Gupta, & Sons, 2009).
Results
Search outcomes
We found the research studies from all the country regions in our literature review; from all this search, 37 studies have been valid for inclusion in our research. Of the 37 eligible research studies published from all the regions, 34 were full manuscript, and 3 were abstracts.
Outcomes of the studies
Of all these 37 studies from all the six regions of Pakistan (Table 1), to assess the distribution and allelic frequency of each blood type total of 161893 individuals were used. The maximum number of studies from the most populated province/region of Pakistan Punjab has been published out of the total chosen studies, covering most of the population and the least number of studies published from Balochistan province (Table 2). Our investigation found that the overall frequency of Pakistan A, B, AB, and O blood groups was 23.99%, 33.37%, 33.14%, and 9.74%, respectively. The most common blood type in the Pakistani population is B with frequency (33.37%), followed by O (33.14%), then A (23.99%), and AB (9.74%). Among the total population, 90.63% were Rh (D) positive, while the rest of (9.37%) were Rh (D) negative (Figure 1).

Figure 1: Pie charts summarize ABO and Rh (D) distribution in Pakistan. A total of 161893 samples. The national average of blood group: 90.63% for Rh (D) (green color) and 9.37% for Rh (d) (Gray color). Involving 23.99% for A (Green color), 33.37% for B (gray color), 09.74% for AB (Red color) and 33.14% for O (blue color).
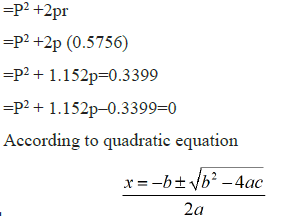
Allelic frequency distribution of blood groups ABO and Rh (D) in Pakistan According to the quadratic equation and Hardy Weinberg law of equilibrium calculated results, the frequencies for IA(p), IB(q), and i(r) were 0.2435, 0.1809, and 0.5756 according to those data. Similarly, the Rh (D) positive and Rh (d) negative allelic frequencies for ID(v) and Id(u) were 0.6939 and 0.3061, respectively (Tables 3 and 4). Allelic frequency of O r2=Phenotypic frequency of O *Observed frequency of O=0.3314 Allele frequency of A WA=AA+AO a=1 b=1.152 p=0.2435 c=-0.3399 *Observed frequency of A=0.2399 Allelic frequency of B According to Hardy Weinberg equation P + q + r=1 0.2435+q+0.5756=1 q=0.1809 *Observed frequency of B=0.3337 Allele frequency of d U2=Frequency of d Phenotype U2=0.0937 U=0.3061 *Observed frequency of d=0.0937 Allele frequency of D V=frequency of D phenotype U + V=1 V=1-0.3061 V=0.6939 *Observed frequency of D=0.9063 According to the Chi-square test for ABO and Rh (D), the goodness of fit was statistically not significant (p ≥ 0.5) (Table 3) ABO and Rh (D) groups distribution with their allelic frequencies on a regional basis in Pakistan Our study divided the state of Pakistan into six regions, including four provinces of Khyber Pakhtunkhwa, Sindh, Punjab, Balochistan, and two autonomous territories of Gilgit Baltistan and Azad Kashmir; details of the regions and its population are given in Table.1. According to our calculated data, blood group B is more prevalent in Punjab (34.41%), followed by Gilgit (33.40%), then Kashmir (32.50%), and Khyber Pakhtunkhwa (31.65%). In comparison, the O blood group is most common in Sindh (36.68%) and Balochistan regions (35%), as described in figure no 2. Individuals with Rh-positive blood groups were dominant in Balochistan (94.75%) compare to the rest of the regions, (Figure 2). Table 1. Six regions of Pakistan with number of districts and populations. Table 2: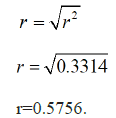
![]()
S.No.
Region
No of Area/District
Population (million)
1
Gilgit (Administrative Territory)
10
02.00
2
Azad Kashmir (Administrative Territory)
10
04.45
3
Khyber Pakhtunkhwa
35
35.53
4
Punjab
36
110.0
5
Sindh
30
47.89
6
Balochistan
33
12.34
Region
Area
A
B
AB
O
Comments
Rh+ve
Rh-ve
Total
Reference
Gilgit
Gilgit
24.2
40
10
25.8
B>O>A>AB
89.8
10.2
150
(Islam & Robert, 2010)
Skardu
30.62
26.8
15.98
26.6
A>B=O>AB
94.83
5.17
1045
(Alam, 2005)
Azad Kashmir
Kashmir
25.93
32.59
17.26
24.2
B>A>O>AB
2300
(Chishti et al., 2012)
83.6
16.4
Poonch
21.4
36.6
7
35
B>O>A>AB
89.5
10.5
3328
(M. Khan et al.,2009)
Mirpur
26.38
32.5
9.47
31.65
B>O>A>AB
91.04
8.96
2937
(M Khalid et al.,2006)
Khyber Pakhtunkhwa
Karak
21.86
32.09
9.76
24.65
B>O>A>AB
88.37
11.63
645
(Abbas et al., 2020)
Hazara
24
32
11
33
O>B>A>AB
85.8
14.2
2300
(Ullah & Ahmad, 2015)
Swabi
27.6
34.4
8.8
32.2
B>O>A>AB
94.3
5.7
2500
(Ullah & Ahmad, 2015)
Peshawar
28
34
7
31
B>O>A>AB
91.87
8.13
429
(Parveen et al., 2016)
Bannu
31.03
36.23
7.67
25.07
B>A>O>AB
89.37
10.63
2581
(M. S. Khan et al., 2004)
Swat
27.92
32.28
10.57
29.1
B>O>A>AB
90.13
9.87
22897
(Khattak et al., 2008)
Bajaur
Agency29.42
30
10.5
30.08
O>B>A>AB
91.43
8.57
1200
(A. u. Rehman et al., 2014)
Nowshehra
27.12
32.04
11.04
29.8
B>O>A>AB
92.88
7.12
4510
(Babar et al.,1999)
Dir Lower
31.94
27.99
27.99
28.66
A>O>B>AB
92.45
7.55
13758
(Ullah & Ahmad, 2015)
Mardan
24.75
27.97
19.36
27.93
B>O>A>AB
94.3
5.7
2893
(MUHAMMAD et al.,2013)
Punjab
Faisalabad
23.8
38
10
28.2
B>O>A>AB
89.1
10.9
200
(Hammed et al.,2002)
Lahore
20.38
40.45
8.09
31.08
B>O>A>AB
89.48
10.52
618
(Kanwal et al.,2016)
Liaqatpur
20.88
35.54
2.02
44.56
O>B>A>AB
90.35
9.65
1389
(A. REHMAN et al., 2005)
Mandi
Bahauddin15.83
28.32
4.48
55.22
O>B>A>AB
91.4
8.6
2524
(Anees et al.,2007)
Multan
26.57
34.15
9.61
29.67
B>O>A>AB
90.72
9.28
937
(F. U. Rehman et al., 2015)
Multan
21.39
37.81
6.97
33.83
B>O>A>AB
92
8
900
(Ullah & Ahmad, 2015)
Gujrat
17.4
22.29
4.35
55.96
O>B>A>AB
79.58
20.42
2647
(Anees & Mirza, 2005)
Bahawalpur
21
36
6
37
O>B>A>AB
95
5
29659
(Ullah & Ahmad, 2015)
Punjab
22.6
32.4
8.6
30.5
B>O>A>AB
93.9
6.1
5000
(Rahman & Lodhi, 2004)
Rawalpindi/
Islamabad25.53
33.33
10.04
31.1
B>O>A>AB
92.45
7.55
2518
(M. S. Khan et al., 2006)
Sahiwal
22
36.9
9.9
31.3
B>O>A>AB
87.1
12.9
20010
(M. I. Khan et al., 2009)
Gujranwala
22.91
35.36
9.32
32.41
B>O>A>AB
92.03
7.97
4754
(Ilyas et al., 2013)
Multan
21.92
36.95
7.33
33.8
B>O>A>AB
92.17
7.83
3000
(Alam, 2005)
Lahore
19.03
38.36
10.62
31.99
B>O>A>AB
93.99
6.01
2900
(Siddiqui et al.,2011)
Rawalpindi/
Islamabad24.2
34.3
10.1
31.3
B>O>A>AB
91
9
4642
(Shakir et al.,2012)
Wah Cantt
18
24
5
53
O>B>A>AB
73.9
26.1
4462
(Iqbal, 2009)
Lahore
24.2
37.8
9.1
28.8
B>O>A>AB
93
7
3000
(UMER et al., 2014)
Islamabad
24.64
34.72
9.28
31.36
B>O>A>AB
92
8
625
(Jabin et al., 2018)
Lahore
20.12
37.45
10.57
32.11
B>O>A>AB
92.97
7.03
514
(Butt et al.,2016)
Sindh
Karachi
24.1
33.1
7.2
35.6
O>B>A>AB
91.1
8.9
3521
(Ahmed et al.,2019)
Sindh
25.83
28.17
8.3
37.78
O>B>A>AB
95.76
4.24
3000
(Ullah & Ahmad, 2015)
Balochistan
Balochistan
23.2
31.7
10.1
35
O>B>A>AB
94.75
5.25
1600
(Hussain et al., 2001)
Total
Observed
Frequency23.99
33.37
9.74
33.14
B>O>A>AB
90.63
9.37
161893
References
- Garratty, G., Dzik, W., Issitt P., Lublin, D., Reid, M., Zelinski, T. J. T. (2000). Terminology for blood group antigens and genes?historical origins and guidelines in the new millennium. Transfusion.,40:477-489.
- Mollison, P. J. T. (1994). The genetic basis of the Rh blood group system.Transfusion.,34: 539-541
- Kondam A., Chandrashekar M., Suresh M., Purushothaman G., Madhuri B., Qairunnisa S. J.. (2012). A study of incidence of hypertension in ABO and rhesus blood group system. Int J Biol Med Res., 3:1426-1429
- Amin-ud-Din, M., Fazeli, N., Rafiq, M. A., Malik, S. J. H. (2004). Serological study among the municipal employees of Tehran, Iran. Distribution of ABO and Rh blood groups. Haema.,7: 502-504.
- Armstrong, B., Hardwick, J., Raman, L., Smart, E., Wilkinson, R. J. (2008). Introduction to blood transfusion technology.I.S.B.T., 3: 254-283.
- Begum, D., Amin, M., Khatun, F., Ahmed, S., Sinha, S., Rahman, M. J. (2011). Distribution of ABO and Rh blood Groups Among Tribal Population of Sylhet, Bangladesh. J Dhaka Med Coll., 20: 44-50
- Hosoi, E. J. T.(2008). Biological and clinical aspects of ABO blood group system. J Med Invest .,55:174-182.
- Rehman, A. u., Wahab, Z. u., Khattak, M. N. K., Malik, S. (2014). ABO and Rh (D) blood groups polymorphism in four tehsils of Bajaur Agency (Federally Administered Tribal Areas), Pakistan. Anthropologist.,18: 259-261.
- Mondal ,B., Maiti, S., Biswas, B. K., Ghosh, D., Paul, S. (2012). Prevalence of hemoglobinopathy, ABO and rhesus blood groups in rural areas of West Bengal, India. J Res Med Sci., 17: 772
- Pennap, G., Envoh, E., Igbawua, I. (2011). Frequency distribution of hemoglobin variants, ABO and rhesus blood groups among students of African descent. Brit Microbio Res J., 33-40
- Cerny, T., Fey, M., Oppliger, R., Castiglione, M., Nachbur, B., Gertsch, M., Gasser, A., Joss, R. A., Thatcher, N. ,Lind , M.,von Rohr, A.,Nydegger, U. (1992). Prevalence of the rhesus-negative phenotype in caucasian patients with small-cell lung cancer (SCLC). Int J Canc., 52: 504-506
- Pinkston, J. A., Cole p. (1996). ABO blood groups and salivary gland tumors (Alabama, United States). Canc caus cont.,7: 572-574.
- Shaheen, S., Nouroz, F., Mujtaba, G., Noreen, S., & Farooq. (2014). A study of seroprevalence of ABO blood groups in Lahore, pakistan. 3: 1-4
- Hemalatha ,N., Bhagya. (2015). Frequency and distribution of blood groups among medical students in davanagere. J Evol med dent sci.,3: 1-4.
- Ilyas, M., Iftikhar, M., Rasheed, U. (2013). Frequency of ABO and Rh blood groups in Gujranwala (Punjab), Pakistan. 59: 107-114
- Khattak, I. D., Khan, T. M., Khan, P., Shah, S. M. A., Khattak, S. T., Ali, A. (2008). Frequency of ABO and Rhesus blood groups in District Swat, Pakistan. J Ayub Med Coll Abbottabad., 20: 127-129.
- Sidhu, S., & Sidhu, L. J. C. A. (1980). ABO blood-group frequencies among the Sansis of Punjab. 4(1), 55-57.
- Guyton, A., Hall, J.. (2000). Blood groups; transfusion; tissue and organ transplantation. 355e361
- Hassan, F. M. (2010). Frequency of ABO, subgroup ABO and Rh (D) blood groups in major sudanese ethnic groups. Pak J Med Res., 49, 21-24.
- Mahmood, M. A., Khawar, S., Anjum, A. H., Ahmed, S. M., Rafiq, S., Nazir, I., Usman, M. (2004). Prevalence of hepatitis B, C and HIV infection in blood donors of Multan region. Annals., 10: 459-461.
- Haruechaiyasak, C., Damrongrat, C. (2008). Article recommendation based on a topic model for wikipedia selection for schools. Paper presented at the International Conference on Asian Digital Libraries.
- Dabholkar, A. (1999). Elements Of Bio Metrical Genetics (revised And Enlarged Edition): Concept publishing company.
- Gupta, S., Gupta, M. J. (2009). Business Statistics. Sultan Chand & Sons, New Delhi.
- Ullah, S., Ahmad, T. J. W. A. S. J. (2015). Distribution of ABO and Rh (D) blood groups in the population of District Dir Lower, Khyber Pakhtunkhwa Pakistan. World App Sci J., 33: 123-135.
- Afzal, M., Hussain, F., & Siddiqi, R. (1977). A survey of blood groups. J Pak Med Assoc., 27: 426-428.
- Nanu, A., Thapliyal, R. (1997). Blood group gene frequency in a selected north Indian population. 106, Indian J Med Res., 242-246.
- Mollison, P. J. A., Analgesia. (1954). Blood transfusions in clinical medicine. 34:59-60.
- Bashwari, L., Al-Mulhim, A. A., Ahmad, M. S., Ahmed, M. A. (2001). Frequency of ABO blood groups in the Eastern region of Saudi Arabia. Saudi Med J., 22: 1008-1012
- Frances, T. (2002). Blood groups (ABO GROUPS). Common laboratory and diagnostic tests. In: Philadelphia: Lippincott.
- Marzban, M., Kamali, M., & Hosseinbasi, T. (1988). Blood groups of the people of Ahwaz, Iran. Anthropol Anz., 83-89.
- Akhigbe, R., Ige, S., Afolabi, A., Azeez, O., Adegunlola, G., & Bamidele, J. (2009). Prevalence of haemoglobin variants, ABO and rhesus blood groups in Ladoke Akintola University of Technology, Ogbomoso, Nigeria. Tre Med Res., 4: 24-29
- Jahanpour, O., Pyuza, J. J., Ntiyakunze, E. O., Mremi, A., & Shao, E. R. (2017). ABO and Rhesus blood group distribution and frequency among blood donors at Kilimanjaro Christian Medical Center, Moshi, Tanzania. BMC Res Not.,10: 1-5
- Guo, N., Wang, J., Ness, P., Yao, F., Dong, X., Bi, X., Mei H.,Li J .,He W .,Lu Y.,Ma H.,Wen X.,Huang M.,Liu J.,Wright D J.,Shan H. (2012). Demographics of apheresis platelet donors in five blood centers in China. Transfusion.,52: 560-566.
- Saad, K. J. J. (2016). Distribution of ABO blood groups and resus factor (RH) in Albiyda/Libya. J med Dent sci.,3: 28-31
- Abbas, A. A. Frequency of ABO and Rh D Blood Groups among Sudanese Blood Donors Attending Central Blood Bank in Wad Medani, Gezira State, Sudan. Int J Med Res Prof., 3: 45-51.
- UMER, K. M., BASHIR, M. W., Rehman, R., KIANI, R. A. (2014). Frequency of ABO and Rh (D) blood groups among blood donors in Lahore, Pakistan. Int J Ad Bio Biomed Res.,2: 597-600
- Kanungo, S., Sah, B., Lopez, A., Sung, J., Paisley, A., Sur, D., Nair, G. B. (2010). Cholera in India: an analysis of reports, 1997-2006. WHO.,88: 185-191.
- Rowe, J. A., Opi, D. H.,Williams, T. N. (2009). Blood groups and malaria: fresh insights into pathogenesis and identification of targets for intervention. Curr Opin Hematol., 16: 480.
- Dewan, G. (2015). Comparative frequency and allelic distribution of ABO and Rh (D) blood groups of major tribal communities of southern Bangladesh with general population and their determinants. Egy J Med Hum Gen.,16, 141-147.
- Islam, F., & Robert, H. J. P.. (2010). Frequency of ABO and Rhesus blood groups in the population of Gilgit area of Pakistan. Pak J Path., 21: 87-91.
- Alam, M. (2005). ABO and Rhesus blood groups in potential blood donors at Skardu (Northern Areas). Pak J Path.,16: 94-97.
- Chishti, H. M., Waheed, U., Ansari, M. A., Wazir, I., Hussain, Z. (2012). ABO and Rhesus (D) blood group phenotypes in Mirpur, Azad Jammu Kashmir, Pakistan, 2008-12. J Pub Heal Bio Sci.,1: 43-46.
- Khan, M., Khaliq, I., Bakhsh, A., Akhtar, M., Amin ud Din, M. (2009). Distribution of ABO and Rh D blood groups in the population of Poonch District, Azad Jammu and Kashmir. East Medit Heal J., 15: 717-721.
- Khalid, M., Qureshi, M. (2006). Frequencies of blood group antigens and corresponding alleles in the population of Mirpur, Azad Jammu Kashmir, Pakistan. J. Anim.Pl. Sci., 16: 96-98.
- Abbas, A., Abbas, B., Aziz, S., Ullah, F., Panhwar, W. A., Ali, A., Khalid,M .,Sadia,H .,Raza,S ., Akhter,K ., Ahmad,W ., Akbar,F., Zeeshan,M., Habibullah, Khan,S. (2020). Prevalence of ABO and Rh Blood Group In District Karak (Female). Bull. Env. Pharmacol. Life Sci., 9: 31-34
- Parveen, N., Rehman, J., Hassan, S. H., Hassan, Z., Rehman, M. (2016). Different Blood Groups. Professional Med J.,23: 1001-1004.
- Khan, M. S., Subhan, F., Tahir, F., Kazi, B., Dil, A., Sultan, S. (2004). Prevalence of blood groups and Rh factor in Bannu region NWFP (Pakistan). Pak. J. Med. Res., 43: 8-10.
- Babar, M., Hassan, H. S., Ullah, H., Khan, M. (1999). ABO and Rhesus blood group distribution in District Nowshera. J Postgrad Med inst.,13. 70-72.
- Hammed, A., Hussain, W., Ahmed, J., Rabbi, F., Qureshi, J. (2002). Prevalence of phenotypes and Genes of ABO and Rhesus (Rh) blood groups in Faisalabad, Pakistan. Sci Alert., 5: 722-724.
- Kanwal, S., Qureshi, H. J., Aslam, M. S., Masood, S. (2016). Frequency of ABO and Rh blood groups in students of Akhtar Saeed Medical and Dental College, Lahore. Pak J Physiol., 12, 29-30.
- Rehman, A., Saeed, M. A., Khan, M. A., Rafique, A., Ashraf, M., Ali, A., Malik, S. (2005). ABO & Rhesus Blood Groups. Professional Med J., 12: 368-371.
- Anees, M., Jawad, A., Hashmi, I. (2007). Distribution of ABO and Rh blood group alleles in Mandi Bahauddin district of Punjab, Proc. Pakistan Acad. Sci., 44: 289-294.
- Rehman, F. U., Siddiqui, M. M., Nazir, I., Khan, M. M., Zafar, S., Ali, Z.. (2015). Study of ABO and Rh-D Blood Groups among the Common people of Multan City Corporation area of Pakistan. Pak J Med Heal Sci., 9: 892-896.
- Anees, M., Mirza, M. S. (2005). Distribution of ABO and Rh blood group alleles in Gujrat region of Punjab, Pakistan. Proc. Pakistan Acad. Sci., 42: 233.
- Rahman, M., & Lodhi, Y. J. (2004). Frequency of ABO and Rhesus blood groups in blood donors in Punjab. Pak J Med Sci., 20: 315-318.
- Khan, M. S., Farooq, N., Qamar, N., Tahir, F., Subhan, F., Kazi, B. M. (2006). Trend of blood groups and Rh factor in the twin cities of Rawalpindi and Islamabad. J Pak Med Assoc., 56: 299.
- Khan, M. I., Micheal, S., Akhtar, F., Naveed, A., Ahmed, A., Qamar, R. (2009). Association of ABO blood groups with glaucoma in the Pakistani population. Can J Ophtham., 44: 582-586.
- Siddiqui, Z., Chaudhry, M., Nigar, M., Butt, H. (2011).A study of association between ABO and Rh blood groups, sex, age and angina pectoris. 23(2), 113-116.
- Shakir, C. M., Khan, S. A., Ghani, E. (2012). Frequency of ABO and Rh (D) blood groups among blood donors in Rawalpindi/Islamabad area. Pak Armed Forces Med J., 62: 304-306.
- Iqbal, M. (2009). Frequency of ABO and Rh blood groups in Healthy Donors. J Rawa Med Col.,13: 92-94.
- Jabin, F., Waheed, U., Ahmed, S., Arshad, M., Arshad, A., Zaheer, H. (2018). Red blood cell phenotyping of blood donors in Islamabad, Pakistan. golb j trans med., 3: 26-29.
- Butt, D. S., Malik, S., Khalid, M. Z., Aziz, M., Humayun, A. (2016). Gender distribution of ABO and Rhesus blood groups among medical students of a public medical school in Lahore, Pakistan. Proceeding S.Z.P.G.M.I., 30: 77.
- Ahmed, M., Memon, A., Iqbal, K. (2019). Distribution pattern of ABO and Rhesus blood groups among different ethnic population of Karachi. J Pak Med Assoc, 69: 1474-1478.
- Hussain, A., Sheikh, S. A., Haider, M., Rashied, T., Malik, M. R.(2001). Frequency Distribution of ABO and Rhesus Blood Groups in Population of Balochistan, Pak. Pak. Armed Forces Med. J.,51: 22-26.