Research Article - Journal of Biomedical Imaging and Bioengineering (2017) Volume 1, Issue 2
Simulation and evaluation of a cost-effective high-performance brain PET scanner.
Musa S Musa*, Dilber U Ozsahin and Ilker Ozsahin
Department of Biomedical Engineering, Near East University, Nicosia, North Cyprus
- *Corresponding Author:
- Musa S. Musa
Department of Biomedical Engineering
Near East University, North Cyprus
E-mail: musasani912@gmail.com
Accepted date: November 29, 2017
Citation: Musa S. Musa, Dilber U. Ozsahin, Ilker Ozsahin. Simulation and evaluation of a cost-effective high-performance brain PET scanner. J Biomed Imag Bioeng 2017;1(2):53-59.
Abstract
Positron Emission Tomography (PET) plays a vital role in molecular imaging, primarily for cancer detection. Most commercialized PET scanners are dedicated to the whole body (WB) studies, with very few dedicated to organs like the brain, heart and breast. Brain studies require scanners with high spatial resolution and sensitivity, due to the pathologies associated with the brain. On one hand, semiconductor-based PET detectors have an excellent intrinsic spatial resolution but are not cost effective. On the other hand, scintillator-based PET detectors can provide high system sensitivity and are cost-effective, but they lack the spatial resolution required to detect very small brain lesions. Therefore, the intrinsic spatial resolution of such detectors needs to be improved. In order to improve the spatial resolution of scintillator detectors, a brain PET scanner (“MB-PET”) employing 1 × 1× 10 mm3 pixelated lutetium yttrium oxyorthosilicate (LYSO) detector was simulated using Geant4 application for emission tomography (GATE) simulation, and its performance was evaluated with National electrical manufacturers association (NEMA) phantom studies. The complete scanner has a 35.0 cm detector ring diameter, axial field of view (FOV) of 24.5 cm and trans-axial FOV of 31.0 cm. The spatial resolution varied across the FOV from approximately 1.0 to 1.28 mm full width at half maximum (FWHM) in the trans-axial direction and 1.03 to 2.05 mm (FWHM) in the axial direction. The scanner has 3.7% system sensitivity and a scatter fraction of 48%.
Keywords
MB-PET, GATE, MLEM, LYSO Scintillator, CdTe
Introduction
PET is a diagnostic imaging procedure which utilizes pair of back-to-back photons originating from positron-electron annihilation for diagnostic purposes [1]. PET uses has rapidly increase in medical fields, including oncology, cardiology, and neuropsychiatry.
It is used on daily basis as a routine diagnostic procedure in brain metabolism, cardiac function, and cancer detection worldwide. Research works aimed at developing high sensitivity and spatial resolution brain scanners are on-going, these researches are being motivated by the increasing demand for metabolic images to aid early detection of brain tumors and other diseases [2].
Most commercialized PET system designs are dedicated to the whole body studies with a few dedicated to organs like the brain, heart and the breast. Organ dedicated scanners have reduced FOV to the organ of interest which makes them perform excellently at lower cost and also yield excellent results in the course of diagnosis than the WB scanners [3].
The key requirements for high-speed and high resolution PET imaging are detectors with fast decay time, high stopping power and high light output [4]. LYSO cerium doped possess all of these requirements, and therefore it was used in the present study.
Semiconductor-based PET detectors such as Cadmium zinc telluride (CZT) and Cadmium telluride (CdTe) have received much attention due to their high spatial and energy resolutions [5]. However, their main disadvantage is unfavorable cost issues due to the increase in number of readout electronic channels and its associated complexities.
Scintillator-based detectors on the other hand, are typically more flexible with lower system cost because they have fewer electronic channels compared to the semiconductor detectors. Nevertheless, they have large spread of light due to the use of non-structured scintillators. The light spread increases with the thickness of the scintillator leading to poor spatial resolution. Therefore, the scintillation light has to be controlled in order to provide high intrinsic spatial resolution [5].
Laser-induced optical barrier (LIOB) is a profitable fabrication method for scintillator crystals which serves as a substitute to mechanical pixelation. It is used to pixelate crystals into submillimetre size, in a crack free manner thereby increasing the crystal's intrinsic spatial resolution. The whole process of LIOB technique is described in [5,6].
In the present study, the MB-PET employing highly pixelated LYSO scintillator detector was simulated with GATE [7] and the detector performance was evaluated according to NU 4-2008 protocols [8]. The performance tests include spatial resolution, sensitivity, uniformity, scatter fraction and image quality.
Methods and Materials
System specifications and design
The system specifications incorporated in this novel design are done in a way to overcome certain limitations of inorganic scintillator crystals. The results presented at the end of this work are from GATE simulation, and can be relied upon because several scanners simulated using this software package have been tested and validated.
Features of the MB-PET include:
1. High quantum detection and conversion efficiency for 511 keV photons due to the highdensity and atomic number of LYSO (7.1 g/cm3 and 60 respectively.
2. High intrinsic spatial resolution due to highly pixelated LYSO crystal.
3. Depth of interaction (DOI) measurement due to smaller voxels in the crystal block.
4. Short decay time of 41 ns to allow fast response.
This PET design can be employed on different types of PET scanners, whether a small-animal, a whole-body and even a PEM scanner. The design implemented here is dedicated to human brain because of the pathologies associated with the brain and the challenges faced while examining the human brain. The MB-PET (Figure 1) takes a modular form whereby each module is a block of LYSO crystal with total size 3 cm, 4 cm and 24.4 cm in the x, y, and z directions respectively.

Figure 1: The MB-PET (a) Design of an individual detector module (b) detector module showing the crystal pixelation (c) Complete PET scanner with 48 detector modules.
For accurate photon impact point measurement, each module block is highly segmented into 9760 voxels of 1 × 1× 10 mm3. Lastly, the module is repeated 48 times to obtain a cylindrical PET with a total of 468,480 detector voxels.
The whole detector module faces the center of the cylinder with its active part thereby allowing 511 keV photons to enter from the edge of the LYSO crystal. The superb density of LYSO crystal gives it a superior stopping power over other scintillator crystals. The system specifications are shown in Table 1.
| Detector size (cm3) | 3 × 4 × 24.4 |
| Detector voxel (mm3) | 1 × 1 × 10 |
| Number of detector modules | 48 |
| Detector ring diameter (cm) | 35 |
| Trans-axial FOV (cm) | 31 |
| Axial FOV (cm) | 24.5 |
| Crystal | LYSO |
Table 1. System specifications
Simulation
The system was simulated using Geant4 Application for Emission Tomography (GATE version 7.2), and the system performance, as well as the image quality, were evaluated and assessed respectively. GATE is a form of Monte Carlo simulation that plays an important role in the design of new imaging devices and acquisition protocol optimization. It can also be used to assess or develop image reconstruction algorithms or correction techniques.
GATE contains the Geant4 library to actualize a versatile, modular and scripted simulation toolkit suitable for use in the nuclear medicine field. GATE permits an exact simulation of the interaction between a particle and a material within a prescribed scanner geometry, and it has also played an important role is the characterization of Time-dependent processes like detector or source movement and source decay kinetics [9].
The GATE codes permits simulation of the whole system parts such as The PET gantry, PET detector arrangement, photomultiplier tubes and related electronics, light guides, coincidence circuits and processors, digitizer, data processing systems etc. Further detailed explanation to GATE simulation of PET scanner employing a scintillator crystal and related electronics can be found in [9], and GATE validation can be found in [7].
Image reconstruction (Maximum Likelihood Expectation Maximization (MLEM))
MLEM is mostly applied to solve incomplete data problems. It is a standard statistical estimation technique which produces an estimate that most likely leads to the measured data. It is very effective in finding the Maximum likelihood estimate. The method works by forward projecting an initial uniform or blank image into a projection area.
Then, both the estimated and measured projections are compared by determining the ratio between them. A correction term is provided by back-projecting the ratio from the projection area to the image area and weighted correctly. Lastly, a new estimate is generated by multiplying the correction term with the present image estimate.
The whole step is repeated several times and ML solution is achieved through image estimate convergence. Although this method has advantages like predictable and consistent convergence manner, it also has drawbacks like very noisy images.
To solve this, the algorithm is stopped before convergence. In addition to the previous solution, noise suppression is done by smooth filter application on the reconstructed image. The second drawback is its slow convergence. It typically requires much iteration and also takes more computation time when compared to FBP [10].
Performance evaluation
Sensitivity: To measure the MB-PET sensitivity, we followed the NEMA NU 4-2008 protocol. The test recommends that a 22Na point source of less than 0.3 mm diameter be embedded inside a 10 × 10 × 10 mm cube (Figure 2).

Figure 2: Sensitivity measurement phantom
The source activity should be less than that at which either the random coincidence rate exceeds 5% of the total event rate or the percent dead-time losses exceeds 5%. 1 megabecquerel (MBq) was used as the source activity.
The source was positioned at the CFOV of the system to acquire the first measurement. 106 coincidences were obtained and maximum of 6 measurements were taken at the CFOV. The total system sensitivity was obtained using equation
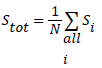 (1)
(1)
Where A is the source activity measured in Bq, Ri represent the total counts rate (cps) collected in source position i, and RB,i represent the background event rate obtained with no source in the scanner field of view. Total system sensitivity of 3.7% was achieved as shown in (Figure 3). According to this test, the sensitivity of the MB-PET is comparable with that of other brain PET scanners as shown in Table 2.

Figure 3: System sensitivity of the MB-PET with no correction technique applied
| Brain PET scanners | Sensitivity (%) | Energy window |
|---|---|---|
| MB-PET | 3.7 | 350-650 |
| ECAT HRRT | 4.3 | 250-650 |
| HRRT-D | 3.3 | 350 650 |
| HOT-PET | 9.2 | 300 675 |
| JPET-D4 | 11 | 400 600 |
Table 2. Sensitivity comparison between MB-PET and other PET systems
Based on the values shown in Table 2, the sensitivity of the MB-PET can be averagely classified. Although some of the scanners have higher sensitivity values, due to wider energy window (ECAT HRRT and HOT-PET) and the use of multiple rings of detector (JPET-D4).
Scatter fraction: In order to test for the scatter fraction (SF) of the MB-PET, NEMA NU 4-2008 suggest that a cylindrical phantom (Figure 4) made of polyethylene, with 70 ± 0.5 mm length and 25 ± 0.5 mm diameter be used.

Figure 4: Scatter fraction measurement phantom
The cylinder has a 3.2 mm diameter opening at radial distance of 10 mm and it is parallel to d central axis. A line source 60 mm long with an outside diameter that can fit the 3.2 mm opening of the phantom, is made of flexible tubing with a fillable section 10 mm less than the phantom.
It contains a known quantity of radioactivity and is inserted into the 3.2 mm hole. The source activity should be low enough so that random event rates can be less than 1% of the true event rate. The test recommends placing the phantom in the CFOV parallel to the z-axis. For the SF calculation, minimum of 500,000 coincidences should be obtained. The source used was 18F, and the activity was 10 MBq. The mean SF is estimated as
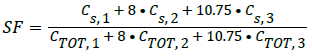 (2)
(2)
Cs represents number of scatter counts, CTOT=True+scattered counts. The numbers 1, 2, and 3 represent the radial locations within the phantom.
The phantom was placed in the trans-axial and axial center of the scanner and the measurements were taken. Unlike real scanners where the number of scattered events are estimated from sinogram profiles, simulated scanners have a known true, scattered, and random event rate. The calculated mean SF of the scanner is 48%. Comparison of the SF result and that of other scanners is shown in Table 3.
| Brain PET scanners | Scatter Fraction (%) | Energy window (keV) |
|---|---|---|
| MB-PET | 48 | 350-650 |
| G-PET | 39 | 410-665 |
| HRRT ECAT PET | 52.9 | 250-650 |
Table 3. Comparison of SF between MB-PET, G-PET and HRRT ECAT
Table 3 shows that the MB-PET has a competitive scatter fraction value with other scanners employing scintillator crystals. Moreover, the SF value is within the normal values of PET scanners based on scintillator crystals. The SF was compared to above-mentioned scanners, because their performance was tested using the same procedure as the simulated scanner.
Spatial resolution: For this test, a phantom similar to that for sensitivity test was used. The source activity is less than that at which either the random coincidence rate exceeds 5% of the total event rate or the percent dead-time losses exceeds 5%. 1 MBq was used as the source activity. Per measurement, minimum of 106 coincidences were collected.
MLEM algorithm was used to reconstruct the images. FWHM values for the measured point spread function (PSF) in all three directions was determined and shown in Table 4. Spatial resolution results are approximately 1.0 to 1.28 mm (FWHM) in the trans-axial direction and 1.03 to 2.05 mm (FWHM) in the axial direction. Comparison of the spatial resolution result with other PET systems is shown in Table 5.
| Positions (mm) | 0 | 10 | 100 |
| Radial Res. (mm FWHM) | 1.01 | 1.02 | 1.28 |
| Tangential res. (mm FWHM) | 1.01 | 1.21 | 1.41 |
| Axial res. (mm FWHM) | 1.03 | 1.27 | 2.05 |
Table 4. Spatial resolution of the MB-PET with no correction technique applied.
| Brain PET scanners | Spatial resolution (mm FWHM) |
|---|---|
| MB-PET | Axial=1.03 to 2.05 trans-axial=1.01 to 1.28 |
| ECAT HRRT | Axial =<2.4 |
| HRRT-D | Axial =2.5 to 3.4 trans-axial=2.3 to 3.2 |
| HOT-PET | Axial=2.8 to 3.9 trans-axial=2.7 to 4.0 |
| JPET-D4 | Axial=<3 |
Table 5. Comparison of spatial resolution result with other brain PET scanners
From the above table, it is obvious that MB-PET has an improved spatial resolution compared the other PET scanners, this is due to the high intrinsic spatial resolution of the LYSO crystal.
NEMA NU 4-2008 image quality test: This test was carried out with an image quality phantom placed at the center FOV of the scanner. Images were reconstructed from 10 million coincidences as required by NEMA NU 4-2008. 3.7 MBq activity was used for this test and the images were reconstructed with MLEM. No corrections and normalization were applied because the data are from simulation.
The pixel size and slice thickness are 0.5 mm and 2 mm respectively. The NEMA image quality phantom, emitting point digital map image and the reconstructed images of the hot rods, uniform region, and cold inserts are shown in Figure 5. The line profiles of the phantom images are shown in Figure 6.

Figure 5: (a) NEMA image quality phantom (b) emitting point digital map image (c) reconstructed images, from Left to right: hot rods, cold inserts, and uniform region.

Figure 6: Line profiles of the reconstructed images, from top to bottom: hot rods, cold inserts, and uniform region.
Uniformity test: The uniformity test is performed using a cylindrical volume of interest, 22.5 mm diameter and 10 mm length. This cylinder is drawn over the center of the uniform region of image quality phantom. The obtained result is shown in Figure 7.

Figure 7: Reconstructed image of uniformity test (top) and corresponding line profile (bottom).
Derenzo-like phantom study: The imaging performance of the MB-PET was also evaluated using Derenzo-like hot sphere phantom. The Phantom is filled with 22Na, rods size is from 1.2 to 3 mm diameter. The phantom images were reconstructed using MLEM. 10 million coincidences were collected and the voxel size is: 0.5 × 0.5 × 1.0 mm3.
Figure 8 shows the emitting point digital map image, reconstructed image and corresponding line profile. It also shows that 1.2 mm hot spheres are resolvable with no correction technique.

Figure 8: Derenzo phantom emitting point digital map image (top) and reconstructed image with corresponding line profile (bottom).
Conclusion
This study shows that the MB-PET is capable of achieving higher spatial resolution at lower cost. From previous published studies, it was evident that such kind of spatial resolution is only achievable by small animal PET scanners. Furthermore, the system has an improved spatial resolution when compared to other brain PET scanners, but the system’s sensitivity is on the average side. The result also showed that the MB-PET is capable of resolving 1.2 mm hot rods with no correction technique applied. From the results, it is evident that should the MB-PET be developed, it will enhance brain tumor diagnosis.
Acknowledgements
This work is fully supported by Centre of excellence, Near East University
References
- Sweet, W.H. The use of nuclear disintegration in the diagnosis and treatment of brain tumor. New England Journal of Medicine. 1951;245:875-878.
- Sabet H, Kudrolli H, Singh B, et al. Fabricating high resolution and high-sensitivity scintillator arrays using laser induced optical barriers. Proceedings of the IEEE nuclear science symposium and medical imaging conference. Anaheim. 2012.
- Uzun D, De Lorenzo, G Kolstein M, et al. Simulation and evaluation of a high resolution VIP PEM system with a dedicated LM OSEM algorithm. Journal of Instrumentation. 2014; 9:C05011.
- Du J, Wang Y, Zhang L, et al. Physical properties of LYSO scintillator for NN-PET detectors. Proceedings of the 2nd international conference on biomedical engineering and informatics. 2009.
- Sabet H, Bläckberg L, Uzun-ozsahin D, et al. Novel laser-processed CsI:TI detector for SPECT. Medical Physics. 2016;43:2630-2638.
- Sabet H, Blackberg L, Ozsahin D, et al. A sub-mm spatial resolution LYSO:Ce detector for small animal PET. Proceedings of the IEEE nuclear Science symposium and medical imaging conference. 2015.
- Jan S, Santin G, Strul D, et al. GATE: A simulation toolkit for PET and SPECT. Physics in Medicine and Biology. 2004;49:4543-4561.
- NEMA Standards Publication NU 4. Performance Measurements of Small Animal Positron Emission Tomographs, National Electrical Manufacturers Association. 2008.
- Nikolopoulos D, Michail C, Valais I, et al. GATE simulation of the Biograph 2 PET/CT Scanner. Journal of Nuclear Medicine & Radiation Therapy. 2014;6.
- Tong S, Alessio A, Kinahan P. Image reconstruction for PET/CT scanners: past achievements and future challenges. Imaging in Medicine. 2010;2:529-545.