Research Paper - Journal of Applied Mathematics and Statistical Applications (2018) Volume 1, Issue 2
Reliability and therapeutic decision through generalizability theory: An application in prostate cancer treatment
- *Corresponding Author:
- Carolina Lagares-Franco
Department of Statistics and Operational Research University of Cadiz Spain
Tel: +34 696 212 036
E-mail: carolina.lagares@uca.es
Accepted date: December 11, 2018
Citation: Lagares-Franco C, Salas-Buzón MC, Gutiérrez-Bayard L, et al. Reliability and therapeutic decision through generalizability theory: An application in prostate cancer treatment. J Appl Math Statist Appl. 2018.;2(1):42-46.
Abstract
Introduction: Now-a-days there are several therapeutic techniques in hospitals and multiple factors that can modify the measurements for treatments. Health professionals should have objective information, in terms of reliability for therapeutic decisions. In our area exist different methods for the treatment of the prostate cancer via external radiotherapy. For each of them there are some factors that can affect the data collected to apply the treatment. The aim of this study is to use statistical advanced techniques, the Generalizability Theory, to evaluate the reliability for three image-guided radiotherapy methods to treat cancer with external radiotherapy: Electronic Portal Imaging (EPI), Cone Beam by Fiducial Markers (CBFM) and Cone Beam by Soft Tissues (CBST).
Methods: Forty patients with prostate cancer were enrolled in a prospective study. Before each daily session, EPI, CBFM and CBST images were sequentially acquired for eleven days in three positions: lateral, vertical and longitudinal. Generalizability Theory is used to analyze reliability and estimate other situations for radiotherapy application.
Results: Generalizability Theory shows high reliability for each method, one by one and among each other. We obtain high reliability also for each position but not two-by-two positions. Using only one method we obtain 0.9 reliability or more, from fifteen sessions.
Discussion: Generalizability Theory is a powerful statistic methodological tool that allows obtaining reliability coefficients in many different situations to help health professionals in therapeutic decisions.
Keywords
Reliability, Generalizability theory, Image-guided radiotherapy, Prostate cancer, Therapeutic decisions.
Introduction
For the majority of diagnostic and therapeutic decisions, a systematic data collection is necessary to evaluate the clinical judgment and the consequent patient treatment. All diagnostic tools should guarantee, in terms of reliability, the quality of the collected data (images, numbers, and any other typology of data). Collected data can be affected by several factors such as the diagnostic tool itself, the measurement instrument, the time when the data are collected etc. Knowing the factors leading to main errors in the data collection process will provide the health professionals with objective information necessary for their work.
To evaluate reliability, the medical literature reports the Cronbach's alpha [1] and the Intraclass Correlation Coefficient [2] (ICC) as the most used statistical tools. Nevertheless, these coefficients can be used only for the simple data collection. In order to take into account all the factors which could generate an error in the data collection process, it is necessary to use methodological statistical tools which are more powerful than classic coefficients.
Against this background, this study suggests the analysis of reliability throughout the Generalizability Theory (GT) [3-6]. GT and Classical Theory (CT) have several common elements but GT treats more in details reliability and its different aspects [7-10]. For instance, this theory permits not only to obtain general reliability coefficients, but also to quantify through percentages the error caused by the different factors (patients, methods, medical visit …) intervening in the data collection process using Analysis of Variance (ANOVA) methods. Moreover, it gives information for hypothetic data collection situations that provide the specialist medical staff objective information for clinical decision making.
GT is mostly used in educational [11,12] or psychology and psychiatry [13] contexts but not in clinical research situations. In a previous work we have obtained reliability coefficients to evaluate reliability among imaged methods using the Intraclass Correlation Coefficient (ICC) in a simple context [14].
The proposal of this study is based on the use of GT in the field of Image Guided Radiation Therapy (IGRT) for the treatment of the prostate cancer via external radiotherapy. GT allows to calculate the number of errors which are due to the different sources which can influence the data collection process and provide useful information for therapeutic treatment.
Materials and Methods
This study is based on a cohort of 40 male patients with early prostate cancer, all included in the protocol of radical external radiotherapy and image-guided radiotherapy of the University Hospital “Puerta del Mar” in Cadiz, Spain. These 40 patients have received, for a total of 38 days, a daily session of external image-guided radiotherapy in an ONCOR Linear Accelerator (Siemens) with 6Mv photons. All own 4 insertions of intraprostate gold fiducial markers. The correction of the radiation beam before each treatment session has been made through daily orthogonal electronic portal images. During days 1, 2, 3, 4, 5, 10, 15, 20, 25, 30 and 35 of the radiotherapy treatments, before each session, two volumetric images (Cone Beam Computed Tomography, CBCT) have been acquired as well: one with the correction for fiducial markers (CBFM) and the other with the correction for soft tissues (CBST). During these 11 days, the positions in the three spatial axes of the isocenter of the treatment beams have been recorded for each imaging method (EPI, CBFM and CBST): lateral, longitudinal and antero-posterior or vertical.
Before each treatment session, two orthogonal portal images have been acquired for each patient: one antero-posterior radiography and one lateral radiography of the prostatic region. The insertions of intraprostate gold fiducial markers have been used as reference. Then, through an automatic electronic system, these insertions have been localized by superposing each fiducial marker on the markers of the reconstructed digital radiography, thus facilitating the correction of the position of the radiation beam (corrected isocenter) into the real position of the target (2D). In the 3D, CBFM and CBST models, before each patient’s treatment session, an X-ray computed tomography (CT) of the prostate region has been acquired (volumetric image). Thereafter, through an electronic system of manual correction operated by the health professional, the position of the prostate has been adjusted to the reference image of the planning CT in two different ways: using as reference the gold insertions (fiducial markers) in the CBFM, or using the soft tissues (like prostate, rectum and bladder) in the CBST.
In order to apply the G Theory it is necessary to determine from the very beginning of the study what will be measured, and which factors could affect the data collection. In this specific case the measurement object is represented by the 40 patients, here indicated with the letter p. All the factors which are likely to affect the data collection (facets) are: the used method (m), the spatial axes (e), and the occasions when the patient has seen the radiotherapy oncologist, (o). The method facet is constituted by three fixed levels (the imaging methods), the facet axis has three fixed levels as well (lateral, longitudinal and vertical), and the occasion facet is composed by 11 random levels (it could be more or less radiotherapic sessions).
Following this hypothesis, it is possible to imagine a crossed design p×m×e×o for each measurement object in all possible combinations of all levels between a facet and the other. In this design, any observation can be decomposed as the sum of the different affecting factors, either alone or in combination with each other. In other words, the observation realized in a patient (p), through a method (m), in an axis (e) and in one occasion (o) can be written as follows:

Where μ is the global average score on the patient population and the different ϑα are the effects adjusted to the facets, the measurement object and the interactions among them (α represents each of the design effects), i.e., all the interactions which can occur in the data collection among patients, methods, axes and occasions.
The Theory shows that the variability of the observation is determined as the sum of the variabilities of the factors which compose it [6,15]:

With these variances, the researcher can choose news strategies to minimize the scores variance. Every new study plan is called D-study where it is established reliable measurement strategies without the need to collect information again.
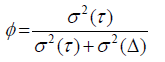
The construction of the reliability coefficient in the D-study is based on the definition of the absolute agreement and the universe score [6] (which in its turn depends on the facets fixed before) of its assumed variances. So, the reliability coefficient ϕ is constructed with the variance of the universe score, σ2 (Δ) , and the variance of the absolute error, σ2 (Δ) :
If we use a crossed D-study p×M ×E ×O, with M and E fixed, where these variances are expressed by:
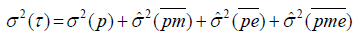 , and
, and
 .
.
But, if we use a nested D-study p×E ×(M :O), with M and E being fixed, where these variances are modified:
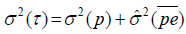 and
and

In general, when the variance of the absolute error is slight respect to the variance of the universe score, the reliability coefficient is next to 1. So, non-controlled factors (random facets) or their interaction with fixed facets or the measurement object do not contribute to the error in the measurement process.
This co-efficient considers values between 0 and 1. The values near 1 denote a high reliability, whereas the values near 0 report its absence. The data used in this study have been analysed with the open office software EduG 6.0 [16]. A total of 3960 images have been acquired from the 40 patients (p), during 11 radiotherapy sessions (o), in 3 spatial axes (e), with 3 imaging methods (m). The use of these data has been approved by the Ethical Committee of the Hospital.
Results
Following the hypotheses described above, the designed model has been applied to the collected data. The ANOVA results are reported in Table 1. The first column shows the factors taken in the design and the combination of all the possible interactions among them. The second, the third and the fourth columns report ANOVA standard information. The fourth column contains the estimates of the variances obtained for each factor or interaction with the G Theory together with the percentage of the variability they represent (column 5). Negative values in variances are due to the estimation methods and they are described in the literature [15].
| Source of Error | Sums of squares | Degrees of freedom | Root mean squares | Variances | % |
|---|---|---|---|---|---|
| p | 150.48274 | 39 | 3.85853 | -0.01037 | 10.6 |
| m | 1.0152 | 2 | 0.5076 | -0.00115 | 0.1 |
| e | 80.9092 | 2 | 40.4546 | 0.02552 | 5.2 |
| o | 1.70953 | 10 | 0.17095 | 0.00004 | 0 |
| pm | 6.54925 | 78 | 0.08396 | -0.00017 | 0.4 |
| pe | 380.45707 | 78 | 4.87765 | 0.13956 | 41 |
| po | 89.15593 | 390 | 0.2286 | 0.0012 | 7.4 |
| me | 8.15552 | 4 | 2.03888 | 0.00443 | 0.6 |
| mo | 0.36891 | 20 | 0.01845 | -0.00013 | 0 |
| eo | 3.19791 | 20 | 0.1599 | -0.00048 | 0 |
| pme | 13.68004 | 156 | 0.08769 | 0.00513 | 1.5 |
| pmo | 25.89775 | 780 | 0.0332 | 0.00063 | 3.2 |
| poe | 168.44027 | 780 | 0.21595 | 0.06155 | 20.9 |
| moe | 1.29037 | 40 | 0.03226 | 0.00002 | 0 |
| pemo | 48.84296 | 1560 | 0.03131 | 0.03131 | 9.1 |
| Total | 980.15264 | 3959 | 100 |
Table 1: Analysis of variance of the p×m ×e ×O Â design.
The percentage of variability given by each factor or interaction of factors can be interpreted as the percentage of error generated by the factors themselves in the data collection. Through a detailed analysis of these percentages, in the isolated factors it is observed that the main variability of percentage is due to patients (10.6%), followed by spatial axes (5.2%). This result is consistent with the fact that patients are distinguished according to their spatial axes, and consequently the main variability in the table is due to the interaction between patients and spatial axes (41%). However, variability is not observed in either the occasions (0%) or the used imaging methods (0.1%). This means that both the imaging methods and the day of image acquisition do not generate any error in data collection. High variability (20.9%) is reported in the triple interaction among patients, spatial axes and measurement occasions. A global overview of the percentages shows that the main error of the process is due to the measurement object itself and that this variability cannot be controlled by the diagnostic-therapeutic staff. Nonetheless, other controllable factors like the spatial axes, the occasions when the images are acquired or the imaging methods themselves, do not represent in general an important source of error for the data collection. This means that the variability of the absolute error described above is negligible with regard to the variability of the universe score. The data of the variance estimates in Table 1 give rise to a global reliability coefficient of 0.94075, through which we obtain a high reliability among the three methods in the three spatial axes in the eleven visits with the radiotherapy oncologist.
Results for crossed D-study p×E ×(M :O)
Table 2 presents an in-depth study of the reliability of the imaging methods. High reliability is reported for the three methods if they are used in an isolated way, with the bidimensional method being the most reliable (ϕ=0.94). Analogously, when analysing the methods two-by-two a high accordance between them is reported, independently from the fact of being bidimensional or tridimensional, or having fiducial markers or soft tissues as reference.
| Methods | ϕ |
|---|---|
| EPI | 0.94 |
| CBFM | 0.93 |
| CBST | 0.92 |
| CBFM vs. CBST | 0,92 |
| EPI vs. CBFM | 0,93 |
| EPI vs. CBST | 0,92 |
Table 2: Reliability of the imaging methods.
The detailed study of the images acquisition in the three spatial axes (Table 3) indicates a high reliability in each isolated axis, but a low reliability in the imaging method if only two of the three axes are used, with the lowest reliability being in the combined use of the lateral and vertical axes (ϕ=0.21).
| Spatial Axes | ϕ |
|---|---|
| Lateral | 0.95 |
| Longitudinal | 0.96 |
| Vertical | 0.95 |
| Longitudinal vs. Vertical | 0.51 |
| Lateral vs. Vertical | 0.21 |
| Lateral vs. Longitudinal | 0.67 |
Table 3: Characteristic quantities of harmonic phenomena classes.
Table 4 shows the reliability analysis of the different occasions when the patient sees the radiotherapy oncologist by using the three imaging methods. Even with the data of only 11 visits, the G Theory permits to estimate the reliability of future visits with no need to collect further information. The obtained results clearly show a reliability coefficient equal or superior to 0.9 from the sixth specialist’s visit, and a reliability coefficient equal or superior to 0.95 from the twelfth specialist’s visit.
| Sessions | 1 | 2 | 3 | 4 | 5 | 6 | 7 | 8 |
| ϕ | 0.59 | 0.74 | 0.81 | 0.85 | 0.88 | 0.9 | 0.91 | 0.92 |
| Sessions | 9 | 10 | 11 | 12 | 13 | 14 | 15 | 16 |
| ϕ | 0.93 | 0.94 | 0.94 | 0.95 | 0.95 | 0.95 | 0.96 | 0.96 |
Table 4: Global reliability of different radiotherapy sessions.
Finally, Figure 1 reports the reliability which could be obtained in the different occasions when the patient sees the radiotherapy oncologist by using only one of the three imaging methods. Results show that at least 15 visits with the radiotherapy oncologist are necessary to reach, with only one imaging method, reliability above 0.9 points.

Figure 1: Reliability evolution of one method in different radiotherapy and oncology sessions.
Overall, high values of reliability are reported in the majority of the described situations, both in isolated and in combined imaging methods, as well as in the spatial axes or in the visits with the radiotherapy oncologist.
Results for nested D-study p×E ×(M :O)
It is possible to suppose that clinical professional use for his patients’ one of the three imaging methods but not necessarily the same method in each session. Following this hypothesis, it can be used a nested D-study p×E ×(M :O) . Using the variance estimations from Table 1, it is easy to calculate σ2(τ) = 0.04652 and σ2(Δ) = 0.0033756, so that the reliability coefficient in this situation is ϕ=0.9323. This result shows that the clinical professional obtains high reliability using one of the three imaging methods in each radiotherapy session and that it is not necessary to use always the same method.
Discussion
To treat a cancer patient with radiotherapy is necessary to ensure accuracy, safety, reliability and reproducibility [17]. This study describes a specific situation where the error in the data collection can be due to different sources like the patients themselves, the used imaging method, the spatial position taken into account or the occasions when the images are acquired (radiotherapy sessions).
Through the G Theory we have obtained not only a global coefficient of reliability among the three imaging methods but also the reliability coefficients of the individual methods and of their combination two-by-two. These results are not possible with classical methods [8]. These data permit to the health professionals to understand the reliability of the acquired images when they use only one method, the combination twoby- two or the three methods in the eleven radiotherapy sessions, and with the information of the three spatial axes (lateral, longitudinal and vertical). Moreover the G Theory permits to calculate the reliability in the different spatial positions of the patient: lateral, longitudinal and vertical, both in isolation and in combination. With these data, the health professionals can understand which specific axis or axes they have to use the data for the radiotherapy treatment.
Health specialist interpret the information obtained from the data to make clinical decisions [18,19]. In this sense it is important to underline that the G Theory can estimate the reliability coefficients in hypothetical situations of data collection with no necessity to collect data once again. Therefore, the reliability has been calculated both in isolation and in combination for the three imaging methods in different visits with the radiotherapy oncologist. Through this reliability analysis, the health professionals can see whether from a specific visit of the patient it is possible to use the average of the measures obtained in the previous visits in order to direct the radiation towards it without decreasing the reliability of the process.
Conclusion
In conclusion, Generalizability Theory has proved to be an effective and powerful statistical methodology tool in this study domain where it had not been explored so far. The G Theory is essential in those situations (like the one presented here) where there are multiple factors to take into account for the data collection, and where these can become a possible source of error. Therefore, it is necessary to know and quantify this error. Once these data acquired, the health professionals can understand which factors should be controlled during the data collection if they want to obtain a high reliability of the observation. Then, the G Theory can provide the specialist medical staff with objective information useful for clinical decision making.
References
- Cronbach LJ. Coefficient alpha and the internal structure of tests. Psychometrika. 1951;16(3):297-334.
- Bartko J, Carpenter W. On the methods and theory of reliability. J Nerv Ment Dis. 1976;163(5):307-17.
- Cronbach LJ. Essentials of psychological testing. (2nd ed), Harper & Row, New York, USA, 1960.
- Cronbach LJ, Rajaratnam N, Gleser GC. Theory of generalizability: A liberalization of reliability theory. Br J Math Stat Psychol. 1963;16:137-63.
- Rajaratnam N, Cronbach LJ, Gleser GC. Generalizability of stratified parallel tests. Psychometrica. 1965;30:39-56.
- Brennan RL. Generalizability theory. Springer-Verlag, New York, USA, 2001.
- Algina J. Elements of classical reliability theory and generalizability theory. Advances in Social Science Methodology. 1989;1:137-69.
- Brennan RL. Generalizability theory and classical test theory. Applied measurement in education. 2011;24(1):1-21.
- Suen HK, Lei P. Classical versus generalizability theory of measurement. J Educ Meas. 2007;4.
- Shavelson RJ, Webb NM, Rowley GL. Generalizability theory. Am Psychol 1989;44(6):922-32.
- Cardinet J, Tourneur Y, Allal L. The symmetry of generalizability theory: Application to educational measurement. J Educ Meas. 1976;13(2):119-35.
- Cardinet J, Tourneur Y, Allal L. Extension of generalizability theory and its applications in educational measurement. J Educ Meas. 1981;18(4): 183-204.
- Salvador-Carulla L, González-Caballero JL, Ruiz M, et al. For the eDESDELTC group. Usability of the eDESDE-LTC instrument: Feasibility, consistency, reliability and validity. 2011.
- Salas-Buzon MC, Gutierrez-Bayard L, Lagares-Franco C, et al. Image-guided radiotherapy using MV for prostate cancer: A correlation analysis between electronic portal imaging with fiducial markers and cone beam CT. J Adv Radiol Med Image. 2015;1(1):101-11.
- Shavelson RJ, Webb NM. Generalizability theory. CA: Sage, Newbury Park. 1991.
- EduG versión 6.0. http://www.irdp.ch/edumetrie/index.htm.
- Goyal S, Kataria T. Image guidance in radiation therapy: Techniques and applications. Radiol Res Pract. 2014.
- Charter RA, Feldt LS. Meaning of reliability in terms of correct and incorrect clinical decisions: The art of decision making is still alive. J Clin Exp Neuropsychol 2001:530-7.
- Southam-Gerow MA, Bonifay W, McLeod BD, et al. Generalizability and decision studies of a treatment adherence instrument. Sage Journals. 2018.