Research Article - Journal of Biomedical Imaging and Bioengineering (2017) Volume 1, Issue 1
Automated diagnosis of acute lymphocytic leukemia and acute myeloid leukemia using multi-SV.
1Department of ECE, Kalasalingam Institute of Technology, Tamilnadu, India
2Department of ECE, Velammal College of Engineering, Tamilnadu, India
- *Corresponding Author:
- Saravana Kumar P
Department of ECE
Kalasalingam Institute of Technology, India
E-mail: sskumar0622@gmail.com
Accepted date: July 28, 2017
Citation: Kumar PS, Vasuki S. Automated diagnosis of acute lymphocytic leukemia and acute myeloid leukemia using multi-SV. J Biomed Imag Bioeng. 2017;1(1):20-24.
Abstract
Leukemia is a blood cancer which is curable one in the early period, especially among children, adults and even for old people too. Most treatments comprise chemotherapy, therapeutic radioactivity therapy, or hormone dealings. The pace of remedy be contingent on the type of Leukemia as well as the age of victims. An early stage of Leukemia can be diagnosed and alleviated by proficient pathologist in patients. Despite a pathologist will also find some difficulty in recognizing and making for positive affirmation in detection of type of Leukemia after analysing the biological features of microscopic image of blasted cell. Therefore, the automated classification system for Leukemia detection is being the need of the hour in order to consume the time in diagnosing. Acute lymphocytic Leukemia, Acute myeloid Leukemia and normal cases of Microscopic images of blood marrow smears initially extracted the nucleus by removing background using segmentation. Then the blasted nuclei’s colour, GLCM and geometric features are extracted and finally these cells are classified as cancerous or non-cancerous cell and its subtypes using multi-support vector machine (SVM) classifier. The accuracy of the classifier evaluated up to 90%. The experimental results shows that proposed algorithm could attain an adequate performance for the diagnosis of AML, ALL and their sub-types.
Keywords
Acute myeloid leukemia (AML), Acute lymphocytic leukemia (ALL), Multi-SVM classifier, Feature extraction
Introduction
As per the survey, the disease “Leukemia” affected victims and demise ratios are 2.67% per year in india and most death ratio 6.6% per year in Iran [1]. The prognosis of Leukemia will dealt with details regarding the type caused, age and health information of the victims. Leukemia affects mostly elderly persons than the adults and children. By giving treatment in the initial stage, the nucleus blast can be stopped and reduced. Mostly, Leukemia causes travail because of non-functioning white blood cells (WBCs) and subsequently, affects the bone marrow which is the factory of blood and exchanges normal blood elements with cancer cells. Basically blood cancer is white blood cell count increasing with immature blast cells and the count of neutrophils and platelets are decreased. The number of blast nuclei is increased in blood is a important symptom of Leukemia [2].
The Leukemia is classified into four types, these are acute lymphocytic Leukemia (ALL), acute myeloid Leukemia (AML), chronic lymphocytic Leukemia (CLL), and chronic myeloid Leukemia (CLL) [3]. Among these types, the most commonly detected from the patients is ALL which now generally agreed that both genetic and environmental influences play an interactive part in the growth of it [4], and involves 70% of the Leukemia cases each year [5].
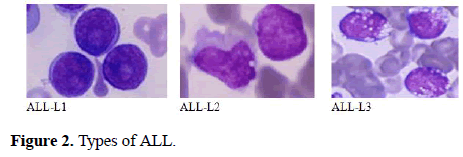
The FAB classification catalogues ALL into three subtypes ALL-L1, ALL-L2 and ALL-L3 (Figure 1) [6-15]. The features of these sub-classes are as follows: ALL-L1 cells are comparatively small with rough chromatin and their nuclei are characterized by a unvarying population. ALL-L2 cells are described by nuclear heterogeneity, and these cells are larger than ALL-L1 cells. And lastly, ALL-L3 cells are having vacuoles inside of the cell and its nuclei are usually standardized in population, and bigger than ALL-L1.
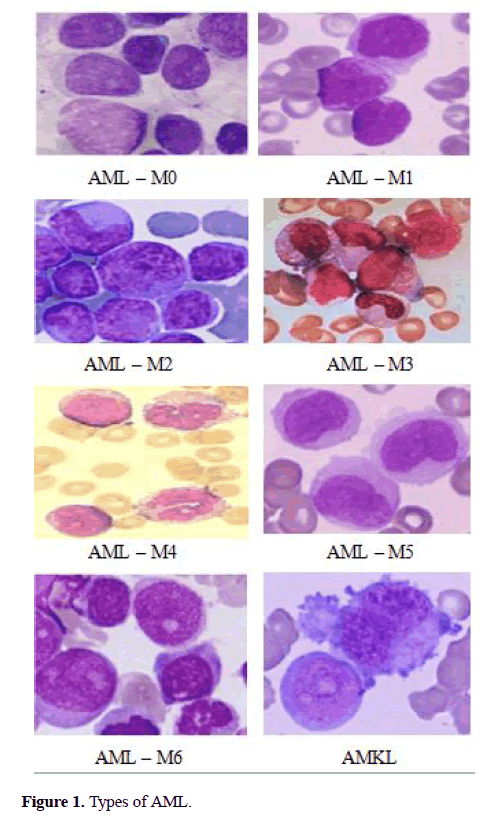
The AML is classified into 8 subtypes (AML-M0 to AML-M7) and its maturing (Figure 2). The chronic Leukemia is matures slowly and it may take several years to becomes serious. But, the acute lymphocytic Leukemia’s maturation is very quick and which may spread in a much shorter period [13]. Manual analysis of the blood smear slides is subjected to unfairness, that is depends on operator experience and tiredness. The manual inspection will be error rate approximately 50% contingent on the experience of the haematologist [13]. This procedure is also time-consuming and tedious. Therefore, the cost-effective and robust system is needed for screening of acute Leukemia and their subtypes which can greatly improve the output without influenced by pathologist. The furthermost of previously proposed approaches were traditional procedures performed by hematologists, that is, segmentation of cell, extracting its features, classifying the cell. The segmentation of nuclei plays a vital role to get correctness of feature extraction and classification. Some of the researchers have proposed the automated classification system for diagnosis of Leukemia as follows, S.Wang [11] proposed a nuclei detection method that employed by using both mean intensity and shape information to improve the segmentation. Theera-Umpon [7] offers separate the nuclei and cytoplasm using automated segmentation based on fuzzy C-means method and morphological operation. Foran [12] proposed a method to differentiate between lymphoma and Leukemia with a classification accuracy attained 83%. Theera-Umpon [6] used the artificial neural network to classify GLCM features of nucleus using Bayes classifier. This method achieved a classification rate of 77% on the test sets.
Mohapattra [9] investigated classifier system for diagnosis of ALL. The results of this method were good and attained 80% accuracy. Bikhet [16] in classified white blood cells into five categories based on shape analysis using the morphological characteristics of outer contour of white cell and nuclei part and the percent of correct classification of cell was observed to be 90% according to the specialists. Mircic [17] proposed a method for automatic classification of leukocytes based on neural network as a classifier. Around 500 blood smear images used for training and testing purpose of the classifier. The complete reported accomplishment rate was 86% for leukocytes. Ramire [18] designed a method for classification of Leukemia cells based on SVM and neural networks using the morphological pattern spectrum. The attained classification accuracy rate was 87%, using 36 training and 18 for testing pattern, with a 3-fold validation scheme.
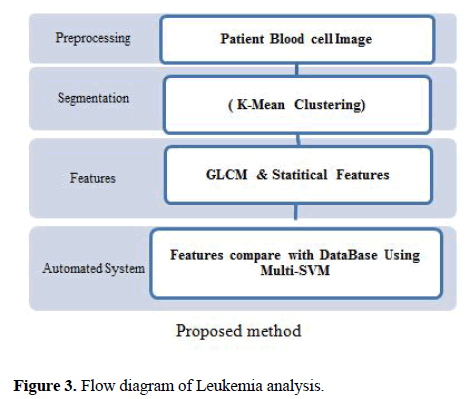
In this paper, we have considered the sub-types of AML (M1, M2, M3) and ALL (L1, L2, L3), These cells have various characteristics based on cell & nucleus shape, colour intensity, roughness and population of blasted cells. Automated detection of AML & ALL cells are the main objective of this study. To accomplish this objective, our work is to classify all cells as AML, ALL and noncancerous cells using multi-support vector machine (SVM) classifier. The automated system is proposed in this paper for identifying this nucleus has four main steps. The first step is image acquisition with pre-processing. The second step is Nucleus segmentation. Segmentation of nuclei is achieved using k-means algorithm. The third step is the Feature extraction. The GLCM and statistical features are extracted from nuclei including area, perimeter, solidity, eccentricity and extent as GLCM features and entropy, mean, standard deviation, energy, skewness, and kurtosis as statistical features. The SVM classifier is the final step for classification of cells. In this approach, the Non-cancerous, AML, ALL and their sub types cells are classified using a multiclass SVM classifier.
The following steps are:
Image acquisition from Microscope to get proper exact data
2. The segmentation to extract the nuclei of cells from background & nucleus Masking by using morphological operation to get perfect segmented nuclei and features
3. Feature extraction
Classifying these nuclei as cancerous and non-cancerous and then identifying sub-types of these cells using SVM.
Methods and Materials
The proposed method for diagnosis of AML, ALL cells and its sub-types is presented in Figure 3
Image acquisition
In image acquisition is very much significant to getting exact dataset. The blood smear microscopic image captured from highly magnification microscope with high resolution digital camera with highly magnification near 1000x and constant magnification are essential. Here the high resolution is cropped to 256 × 256 resolutions to improve to speed processing. Here we have used Blood Microscopic images which are in jpeg format. The captured images were reviewed by the hematologist to determine the correctness and which type of the blood cell. Here 70 digital images is acquired from the subtypes of AML (M1, M2, M3), ALL (L1, L2, L3) and Noncancerous blood samples.
Image Segmentation
The segmentation method used to extract the nuclei from the blood cell images. Segmentation plays a major role for feature extraction and classification [3]. The proposed segmentation algorithm contains two parts; first, cluster of nuclei is obtained by k-means clustering. Then further objects in this cluster are neglected, and connected nuclei are separated. The k-means is a simple clustering method which is unsupervised learning algorithms. Here, it is used for segmentation with parameters: 4 clusters, Euclidean distance. Furthermore, the colour information is represented by HSV colour space. The object of every pixel is categorized into 4 clusters established based on H and S values, using cluster centre and which is resembles to nucleus, background, and other cells [2].
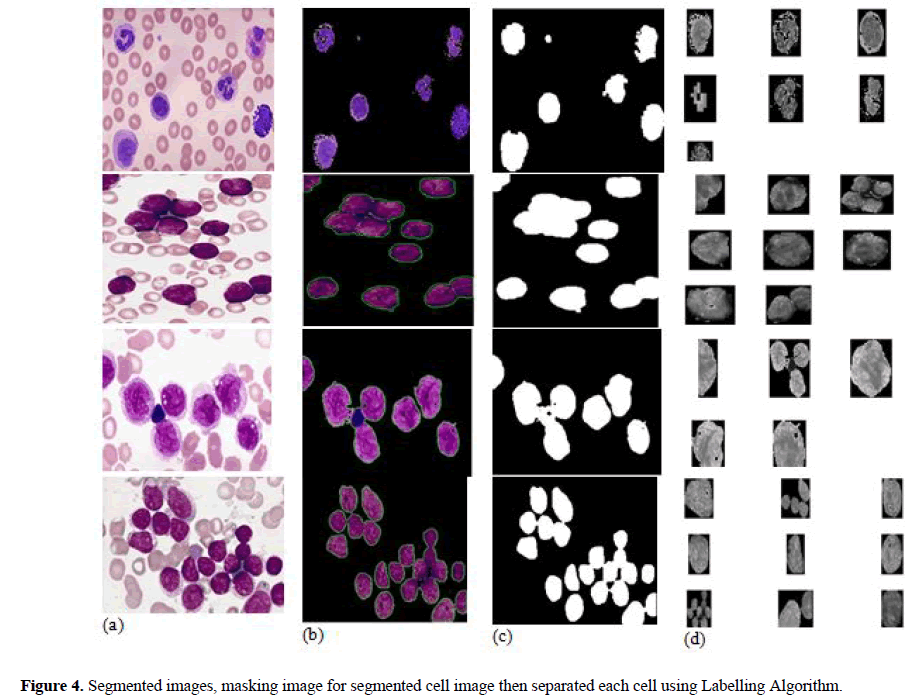
In this paper, after segmented nucleus from background, each nucleus of cell is separated individually to find out features of each nuclei. ‘Nucleus Masking’ and labelling algorithm are used for getting separation of each nucleus of cell. In nucleus masking, first, binary morphological operations are applied on “Nuclei Mask” for cancelling tint relics and filling holes to improve the segmentation results. The artefacts elimination is done by the morphological opening, and closing operation is performed to filling holes in the nuclei. In Figure 4 (b,c,d) shows that input image segmented by k-mean clustering algorithm, then extracted nucleus image is applied in labelling algorithm to get masking and finally each cell is separated to ascertain the features.
Nucleus Segmentation
In this segmentation technique nucleus is extracted from blood smear images. The feature extraction and classification is segmented by successor processing. One of the proposed segmentation is done by k-mean clustering. Then extras are omitted and connected nucleuses are separated. Unsupervised learning algorithm due to its simplicity k-mean clustering technique is used for segmentation using parameter: Four clusters, Euclidean distance & five repetitions. Then colour information into 2 components (i.e) H and S in HSV colour space. Due to this colour space using properties of cluster centre, their 4 cluster of each pixel is done based on H and S values. This cluster corresponds to nucleus and background. Figure 4 shows four classes for a sample image by using kmean clustering to it and nuclei on one class (Figure-4b). In this cluster is mainly considered which have nuclei for feature and cell detection. Thus result shows the cluster with minimum red colour, and then mean value of R channel is calculated for each cluster and minimum value of cluster is taken as cluster of nuclei. After specify this cluster, it was to be unimportant particles, which are form non-nuclei tint artefacts and should be removed. We only consider the nuclei. In some cluster these are linked nucleuses which are merged together. Only single nuclei are desirable for consequent steps, so it should be detached from each other.
The separation of individual nuclei from output of segmented image, “Masking” of nucleus is applied. The morphological opening and closing operation are applied for deleting tint artefacts and filling small holes to get accurate features. After morphological operation individual cells are segregated from the segmented nucleus image to get correct features for individual nucleus and to improve the classification accuracy. Figure 4(b) shows the result of K-means clustered output of nuclei. Figure 4(c) shows “Nuclei Mask”, result of applying morphological operators on Figure 4(b), the artefacts are removed and Inside the nuclei’s small holes are filled, Figure 4(d) shows result of separation of individual nuclei to obtained the features using labelling algorithms. Similarly, each cell’s features obtained for AML, ALL and their subtypes as shown in the Figure 4.
Features
Segmented areas have been used for feature extraction step. At first, the resulting feature provides valuable information for classification of cells into cancerous or non-cancerous and subtypes of these cells. To get better performance of the classifier directly be contingent on the accomplishment of features selection, which is in which find out the optimal set of the features leading to the highest efficiency of the recognition [3]. In the following, we will completely describe these two steps. These two foremost features will provide useful information for further classifying the cancerous or non-cancerous cells and types of these cells consist of AML-M0, M1, M2 and ALL-L1, L2 and L3.
GLCM features: That provides information and characterizes the texture of an image and which are Contrast, Correlation, Energy and Homogeneity
Geometric features: size and shape of the nucleus area, perimeter, solidity, eccentricity, and the extent of the nucleus from the binary image of the nucleus.
Colour features: The mean values of the grey image are acquired which Mean, energy, standard deviation, skewness, entropy, and kurtosis.
After determining an appropriate set of features from nuclei as mentioned above, the next step is to distinguish these nuclei using these features as the inputs classifier.
Classification
The important objective of the classifier is to discriminate which is cancerous or not and to find out various sub-types of Leukemia. SVM is a influential classification tool for data classification depends on hyperplane classifier which is accomplished by a separating surface in the input space of the dataset using different kernel functions as linear or nonlinear such as quadratic, polynomials and radial basis functions (RBF) [10]. Here we used multiclass SVM classifier with 4 classes. For this proposed system, various SVM kernels are used, and their accuracies are compared. Here totally 70 images considered as a test data set. For each sub-type of Leukemia considered 10 images. The characteristics of AML, ALL and non-cancerous cells are loaded in the database. The database trained by the various iteration. The input image is compared with the loaded test data set and found the classifier output. The output has taken one of the images of 70 images given to classifier systems which are compared with the test data set then finally by the SVM result got whether the input image is non-cancer or Sub types of AML & ALL.
Results and Discussion
The above Table 1 illustrate that cancerous and non-cancerous cells are identified according to the AML and ALL classification. In the given blood smear image, we are finding out the correctness and wrongly diagnosed cells with the help of sub types of corresponding classifiers. From this differentiation of method, 90% accuracy is obtained.
| Multi SVM Output | AML | ALL | Non-cancerous cell | ||||
|---|---|---|---|---|---|---|---|
| M0 | M1 | M2 | L1 | L2 | L3 | ||
| M0 | 8 | 1 | 1 | - | - | - | - |
| M1 | 1 | 6 | 1 | - | 2 | - | - |
| M2 | 2 | 1 | 7 | - | - | - | - |
| L1 | - | - | - | 9 | 1 | - | - |
| L2 | - | - | - | - | 7 | 3 | - |
| L3 | - | - | - | 1 | 1 | 8 | - |
| Non-cancerous cell | - | - | - | - | - | - | 10 |
Table 1. M0, M1, M2, L1, L2, L3 & Non-cancerous cells versus result of multi-SVM classifier.
Conclusion
In this proposed method, a computerized classification system has an acceptable performance for the diagnosis between AML & ALL as cancerous cells and non-cancerous cells as well as distinguishing into three categories of AML & ALL that are M0, M1, M2, L1, L2 and L3 cells. In future we attain the high accuracy by updating the Test data set of SVM and by considering Cytoplasm along with nuclei to attain high accuracy.
References
- Mahabir S, Pathak YV. Nutraceuticals and Health: Review of Human Evidence. 2010.
- Moradi-Saeed, Ardeshir. “Recognition of ALL Cells Using K-Means and SVM Classifier”. J-Med-SignalsSens. 2015.
- Mao, Zhao, Zhang, et al. “A new technique for blood cell image segmentation and counting based on PCNN and autowave”. 6-9.
- Yari, Sobhani, Sabaghi, et al. “Frequencies of HLA-DRB1 in Iranian normal population and in patients with acute lymphocytic Leukemia”. Arch Med Res. 2008;39:205-8.
- Ries, Melbert, Krapcho, et al. U.S. National Institutes of Health, National Cancer Institute 2008. SEER cancer statistics review. 1975-2005;907.
- Umpon. ‘Morphological granulometric features of nucleus in automatic bone marrow white blood cell classification”. IEEE. 2007;11:353-9.
- Theera. “White Blood Cell Segmentation and Classification in Microscopic Bone Marrow Images”, in Fuzzy Systems and Knowledge Discovery. 2005;787-96.
- Scotti F. “Automatic Morphological Analysis for Acute Leukemia Identification in Peripheral Blood Microscope Images”. 2005.
- Mohapatra, Patra, Satpathi. “Image analysis of blood microscopic images for Leukemia finding”, IEEE International Conference on Industrial Electronics. Control and Robotic. 2010;215-9.
- Umpon. “WBC Segmentation and Classification in Microscopic Bone Marrow Images”. in Fuzzy Systems and Knowledge Discovery. 2005;787-96.
- Wang. “Novel Cell Segmentation and Online Learning Algorithms for Cell Phase Identification in Automated Time-lapse Microscopy”. 2007; 65-8.
- Foran. “Computer-assisted discrimination among malignant lymphomas and Leukemia using immunophenotyping, intelligent image repositories, and telemicroscopy". IEEE. 2000;4:265-73.
- Abdul-Hamid G. “Classification of Acute Leukemia, Acute Leukemia – The Scientist Perspective and Challenge”. ISBN. 2011;953-978.
- Ludwig, Wolf-Dieter. “Classification of Acute Leukemias, Treatment of Acute Leukemias”.
- Smola AJ, Schölkopf B. “A tutorial on support vector regression”. Stat Comput. 2004;14:199-22.
- Bikhet, Darwishh. “Segmentation and classification of white blood cells”. IEEE International Conference on Acoustics, Speech and Signal Processing. 2000;4:2259-61.
- Mircic. “Application of neural network for automatic classification of leukocytes”. NEUREL. 2006;141-4.
- Ramirez. “Neural networks and SVM-based classification of leukocytes using the morphological pattern spectrum”. Based on biometrics. 2010;19-35.


